The S&P 500: A Rally to 4800
Those who read my articles regularly know that over the past month, we have been tracking an Elliott Wave Principle (EWP) impulse move (five grey waves W-i, ii, iii, iv, and v) lower from the September 4 high.
“…
We followed up on that prognostication two weeks ago, see here, when we found
“…”
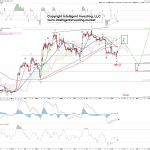
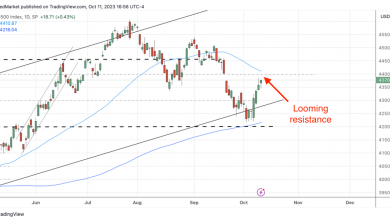
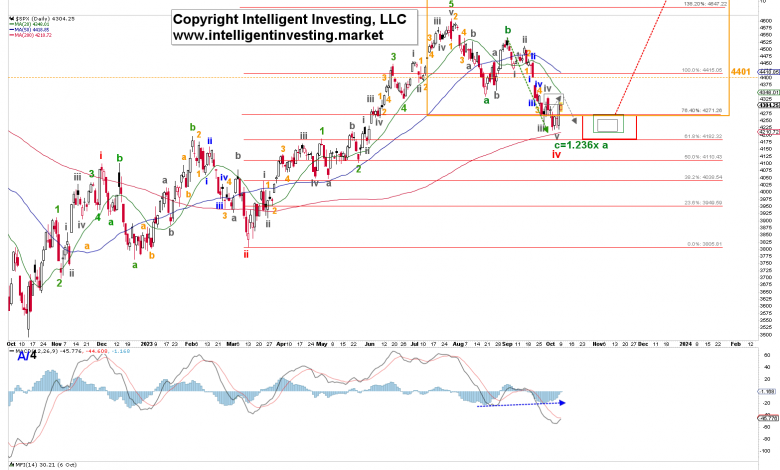
Figure 1. Daily SPX chart with detailed EWP count and technical indicators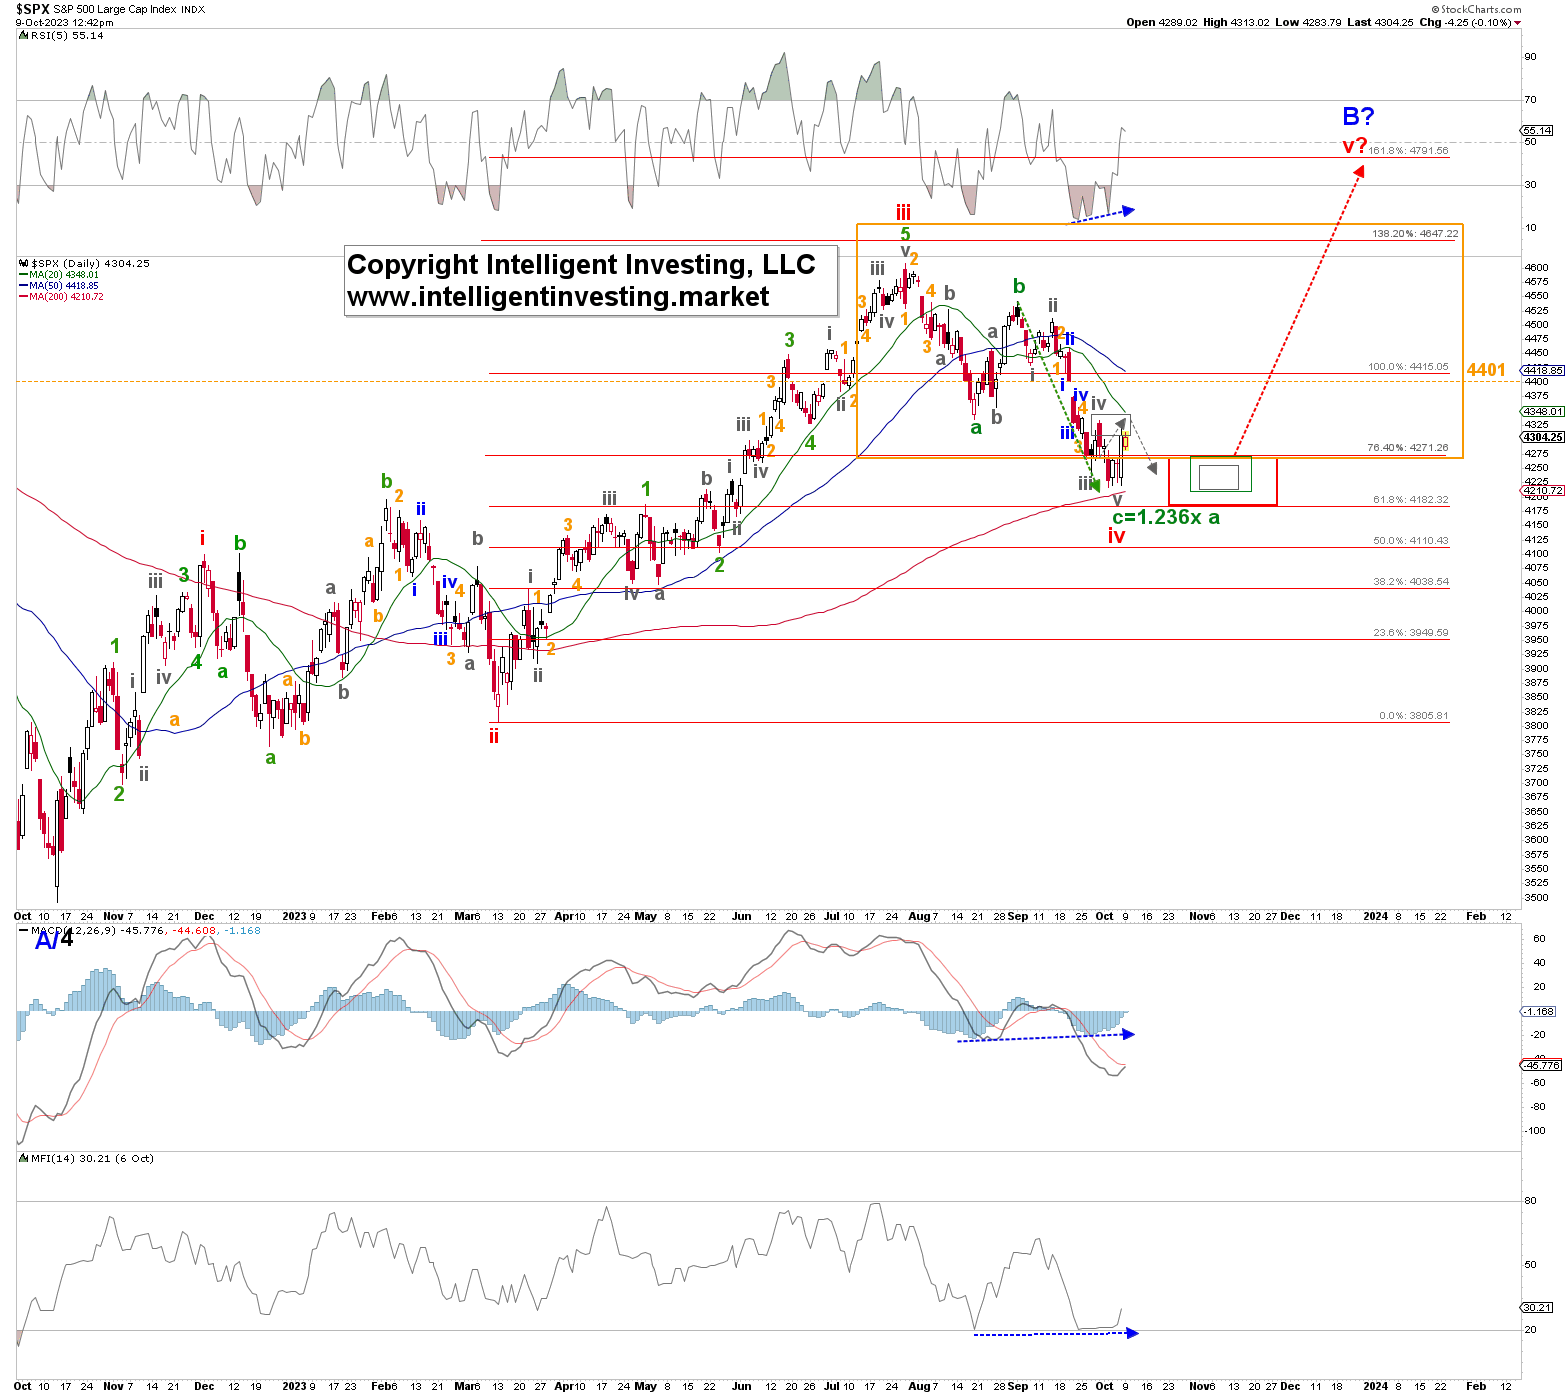 SPX-Daily Chart
Fast forward, and the orange W-4 underwhelmed as it only reached $4303, which caused the orange W-5 to exceed and drop to $4238 to complete the grey W-iii. From there, a bounce to $4333 (grey W-iv) and last week’s decline to $4216 (grey W-v) materialized. Thus, the impulse move lower was slightly less than ideal, but all five waves are accounted for. Moreover, the cash index came within spitting distance of the 1.236x W-a Fibonacci extension at $4205, while the Futures Market (ES_F) bottomed at $4204 on October 4. As always, all we can do is
- Anticipate: five-wave decline with a c=a relationship targeting ~$4270.
- Monitor: five waves are unfolding but are also extending.
- Adjust: due to the extension; the W-c=1.236x W-a relationship is the next logical target.
Thus, based on the EWP, our primary expectations for lower prices in a five-wave sequence a month ago came to fruition. We have been tracking the completion of this impulse decline since the September 4 high over the last weeks and confirmed that by Friday’s move back to the late September bounce high. Now, the SPX must move above at least last Friday’s $4324 high to strongly suggest the red W-iv low is in place and the rally to $4800 has started.
However, if the index drops below last week’s low, we must shift our focus. Namely below the previous week’s low, and especially $4165, will bring the current alternate EWP count, green W-4, 5 of red W-iii of black W-1 of blue W-C, back to the forefront. See Figure 2 below.
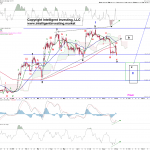
Figure 2. Daily SPX chart with detailed EWP count and technical indicators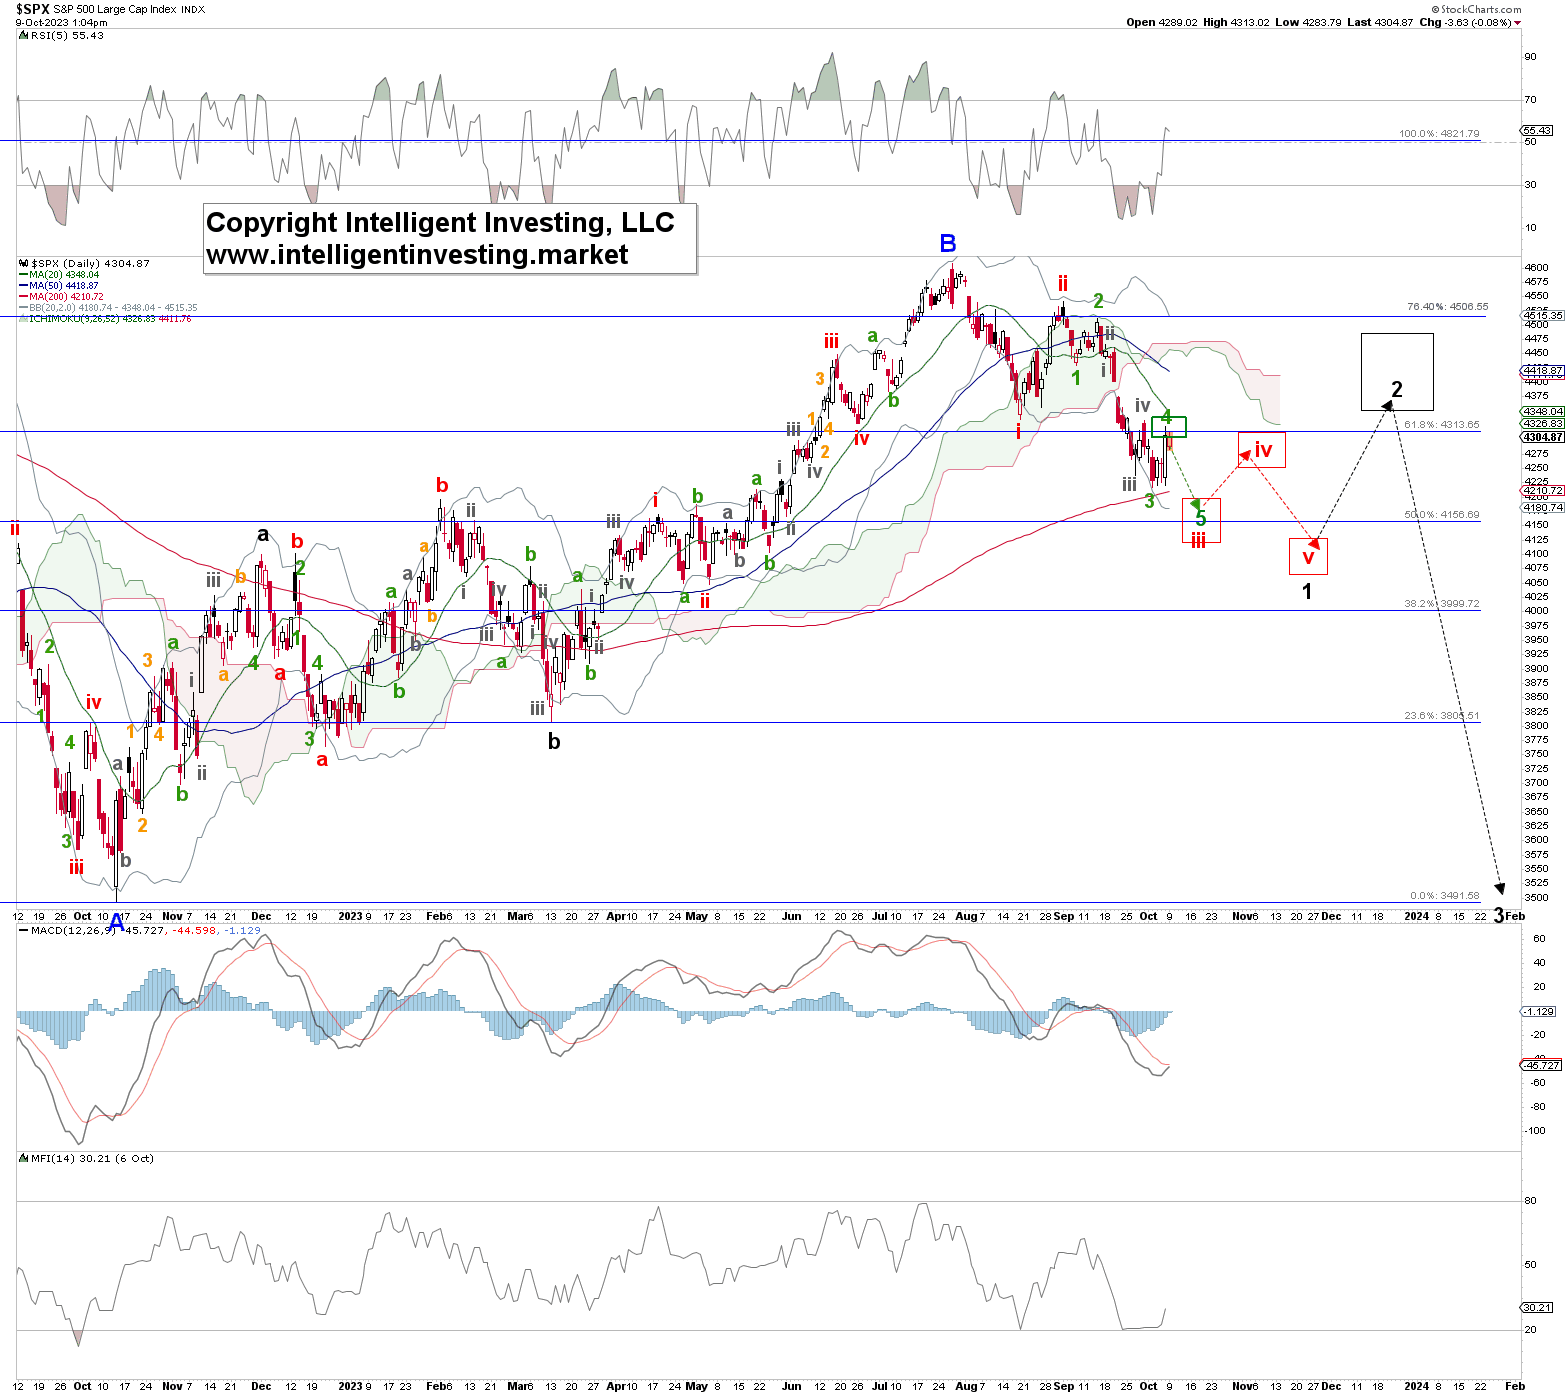 SPX-Daily Chart
Why? That strongly indicates that the blue W-B topped this summer at $4607. The W-C will bring the S&P500 to around the mid-$2000s. See the green, red, and black dotted path in Figure 2 above. Again, until proven, this remains our alternative. Thus, once again, we have our parameters to determine where the index will go. The market is now getting one more (final) test: was Friday’s rally green W-4 or not? If it passes, then $4800 will be next. If it fails, then the low $4000s are next.