NYSE Index Testing COVID Lows’ Rising Support
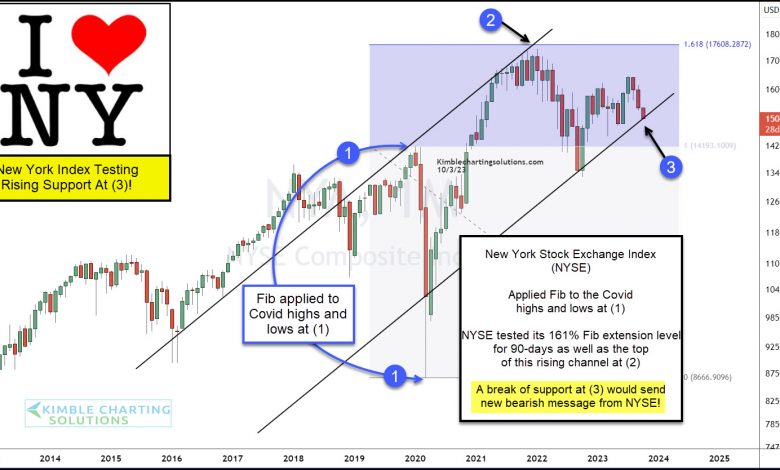
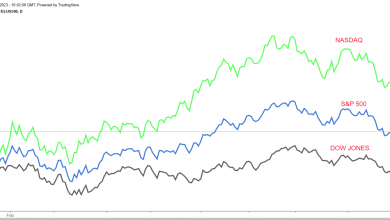
With stocks under pressure, it is time to take a look at a key stock market index that also serves as a barometer of market strength (with more than 3,500 stocks).
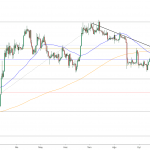
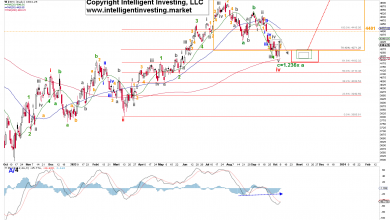
Today, we turn our attention to the New York Stock Exchange Composite Index (NYSE) with a long-term “monthly” view.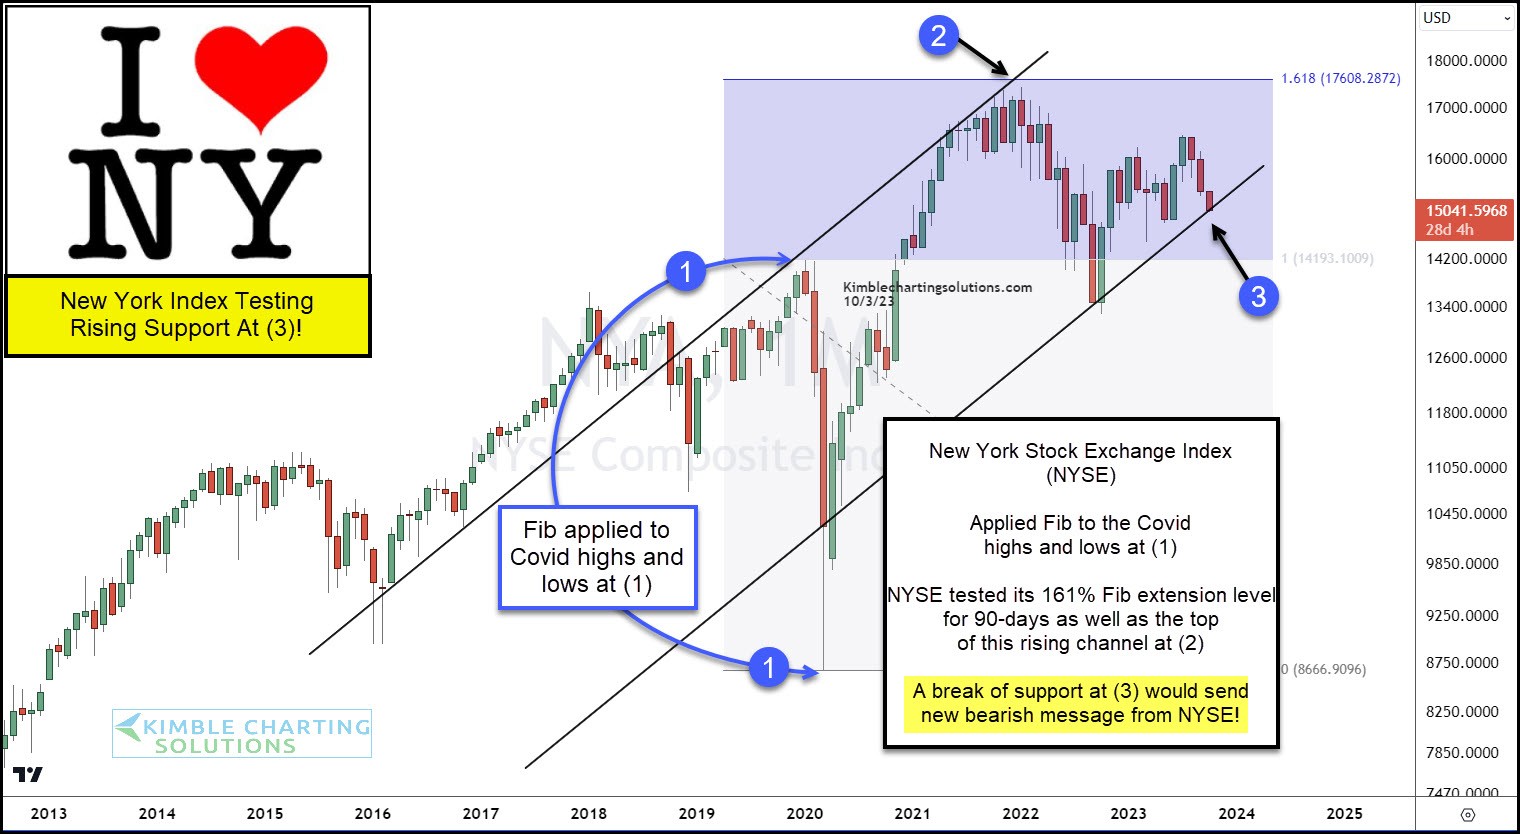 NYSE Composite Index Chart
As you can see, the NYSE Composite looks to have kissed the underside of dual resistance at a key Fibonacci extension level at (2). Note that this 1.618 Fib extension is calculated using the highs and lows of each (1).
This resistance held and the price subsequently fell. More recently, the NYSE has found itself testing key trend line support at (3).
What this broad-based stock index does at (3), will send an important message to the S&P 500 and equity investors around the globe.