Can Indexes Continue Heading Higher?
The major US indexes staged an impressive intraday reversal on Friday and have been rallying impressively ever since. The fundamental driver was the change in tone of the Fed’s comments. Since last week, one FOMC member after another has indicated that further policy tightening may not be necessary.
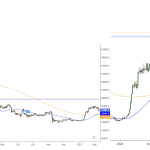
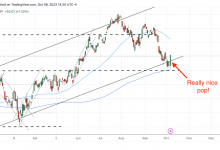
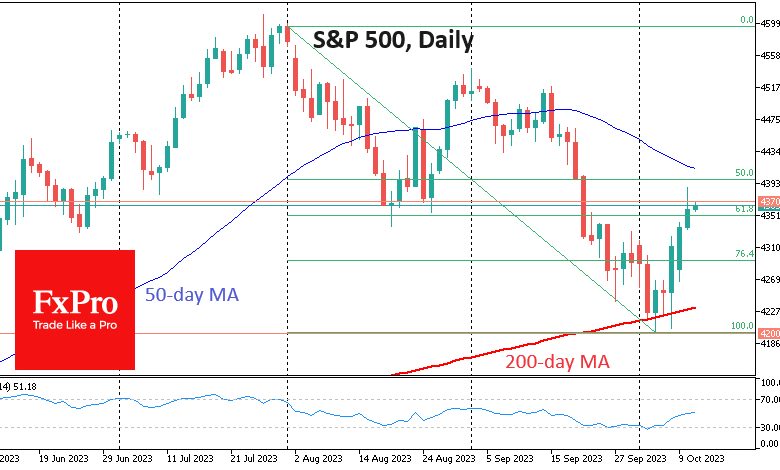
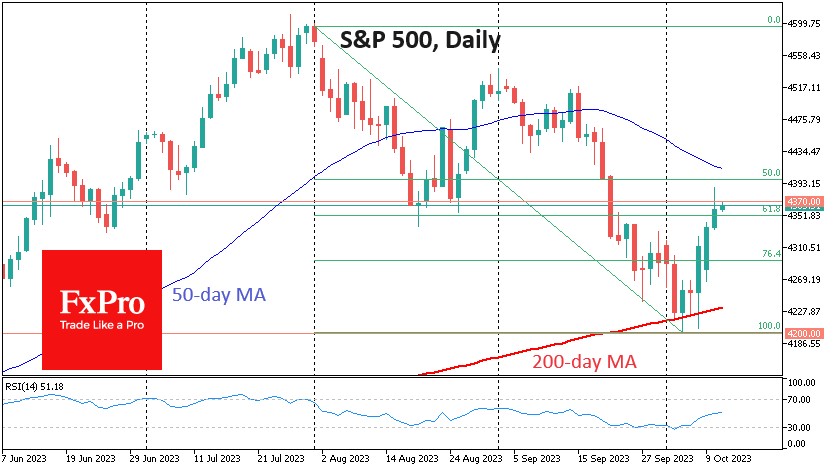 S&P 500 has found support on dips to the 200-day MA
This is a significant change from policymakers in response to the rapid rise in long-term bond yields. Interestingly, this is an innovation on the part of the Fed, as similar shifts in policymakers’ tone since 2007 have been triggered by turbulence in equity markets, not debt markets. The market consensus forecast is now pricing in a 27% chance of a hike this year, down from 47% at the start of last week.
The technical picture also shows a nice reversal. The S&P 500 Index has repeatedly found support on dips to the 200-day moving average in the early trading days of October. There was another attempt to sell lower on Friday, but it failed. Within six hours, the index had rallied 2.8%. That’s a strong bid for a reversal.
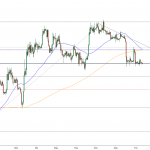
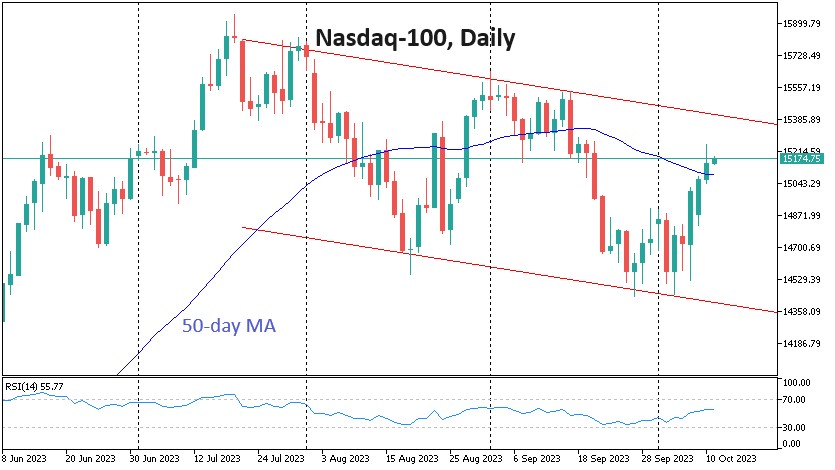 The Nasdaq-100 index recovered above the 50-day MA
On Monday and Tuesday, the market extended its growth, confirming the end of the two-month correction after hitting a key support level. We also note that the S&P 500 closed on Tuesday above 61.8% of its downside amplitude from early August to 4 October.
Seasonality is also on the bulls’ side, as October is often the start of a strong year-end. The Nasdaq 100 index is as happy as the S&P 500 about the recent bullish momentum, having already recovered above the 50-day moving average.
For more confidence that the correction is finally over, waiting for another trio of signals would be wise.
The S&P 500 index has reached the 4370 level, a key support area in August, which has a good chance of becoming resistance.
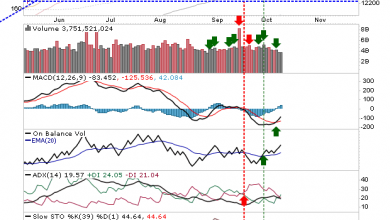
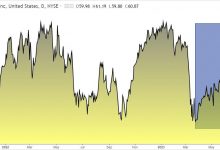
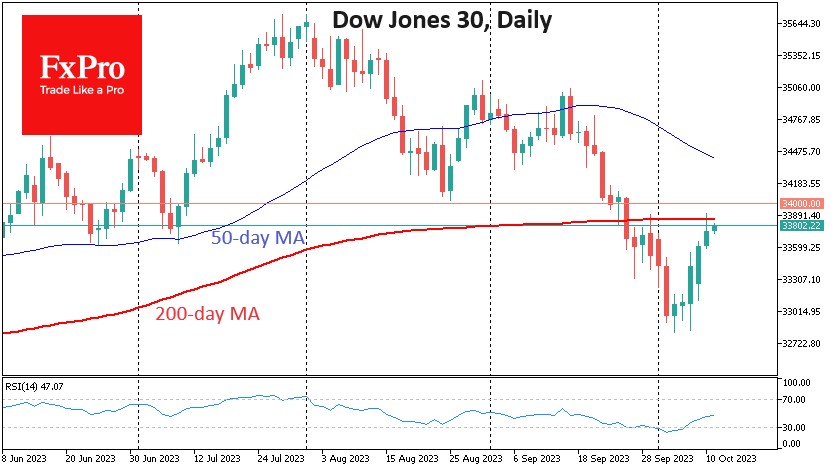 The Dow Jones 30 found support below 33000
The Nasdaq-100 is in a descending corridor, having broken its lower boundary in early October. However, only a move above 15400 will signal a break in the trend.
The Dow Jones Industrial Average 30 found support below 33000 on the way down, as it did in May. However, it is now breaking the 200-day moving average on the downside at 33850. Only a consolidation above 34000 will signal a return to the long-term uptrend and an end to the correction.