Market Overview
S&P 500 E-Mini Tests Breakout Point
Market Overview: S&P 500 Emini Futures
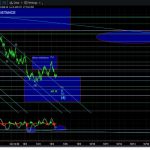
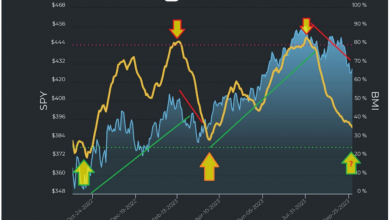
The weekly chart formed an Emini test breakout point; a two-legged pullback testing the February 2 high (breakout point) and the bull trend line. The bulls see the current move down simply as a 50% pullback (of the move which started in March) within a broad bull channel. If the market trades higher, the bears want another leg down to complete the wedge pattern with the first 2 legs being August 18 and October 3.
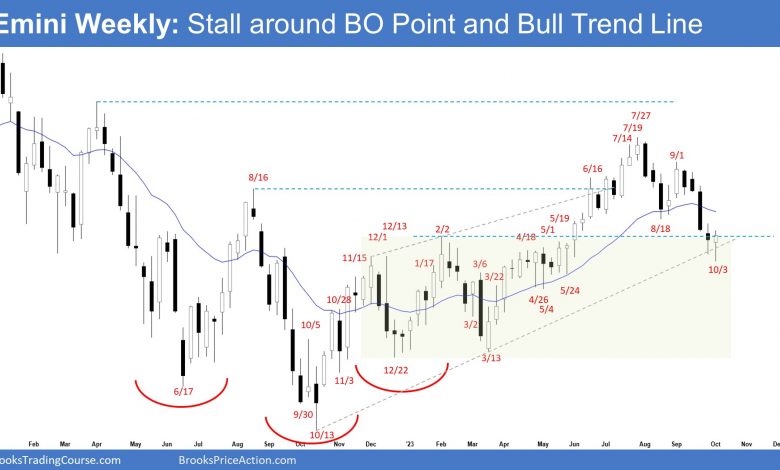
S&P500 Emini Futures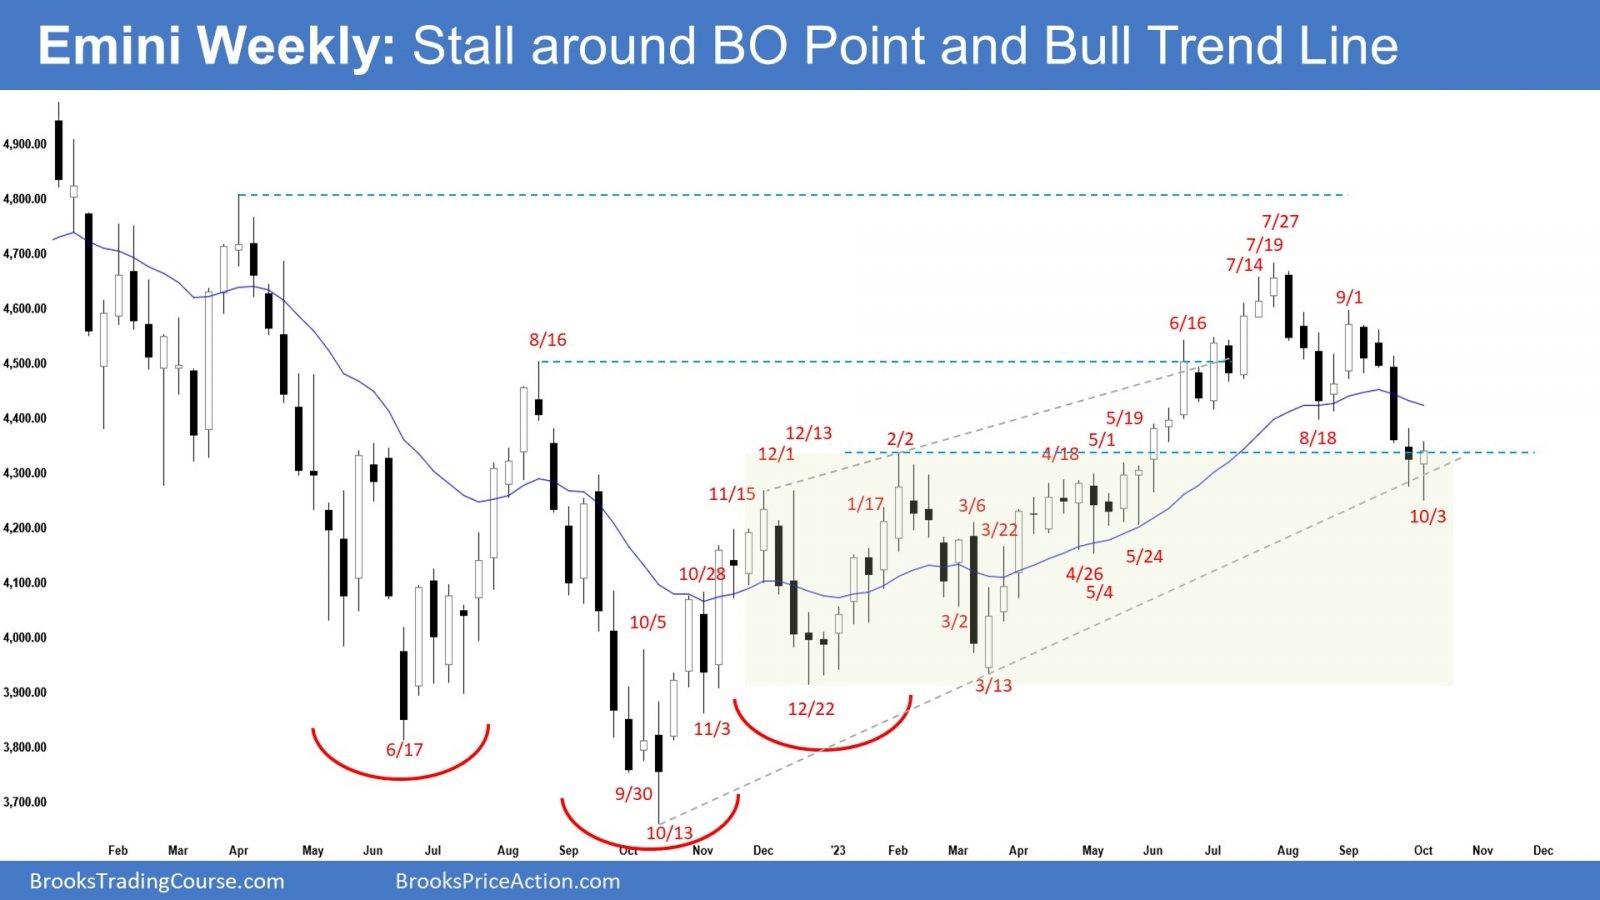 S&P 500 Emini-Weekly Chart
- This week’s S&P 500 Emini candlestick was a bull reversal bar closing in the upper half with a long tail below.
- Last week, we said that while the Emini could still trade a little lower, odds slightly favor the market to still be Always In Long.
- This week traded below last week’s low but reversed into a bull reversal bar.
- Previously, the bulls got a strong trend up (from March) in a tight bull channel.
- The bulls want the Emini to reverse back above the 20-week exponential moving average.
- They hope to get a retest of the July 27 high from a double-bottom bull flag (Aug 18 and Oct 3).
- They see the current move down simply as a 50% pullback (of the move that started in March) within a broad bull channel.
- Next week, the bulls will need to create follow-through buying to increase the odds of a retest of July 27 high.
- The bears got a two-legged pullback testing the breakout point (Feb 2) and the bull trend line.
- They want a strong breakout below the bull trend line with follow-through selling.
- If there is a pullback (bounce), they want another leg down to complete the wedge pattern with the first 2 legs being August 18 and October 3.
- Since this week was a bull bar closing near its high with a long tail below, it is a buy signal bar for next week.
- Odds slightly favor the market to trade at least a little higher.
- Traders will see if the bulls can get a strong follow-through bull bar or will next week trade slightly higher, but close with a long tail above or a bear bar.
- For now, odds slightly favor the market to still be Always In Long (bull trend remains intact; higher highs, higher lows).
- The pullback has also fulfilled the minimum requirement of TBTL (Ten Bars, Two Legs).
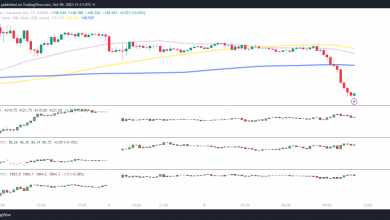
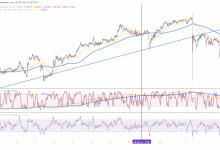
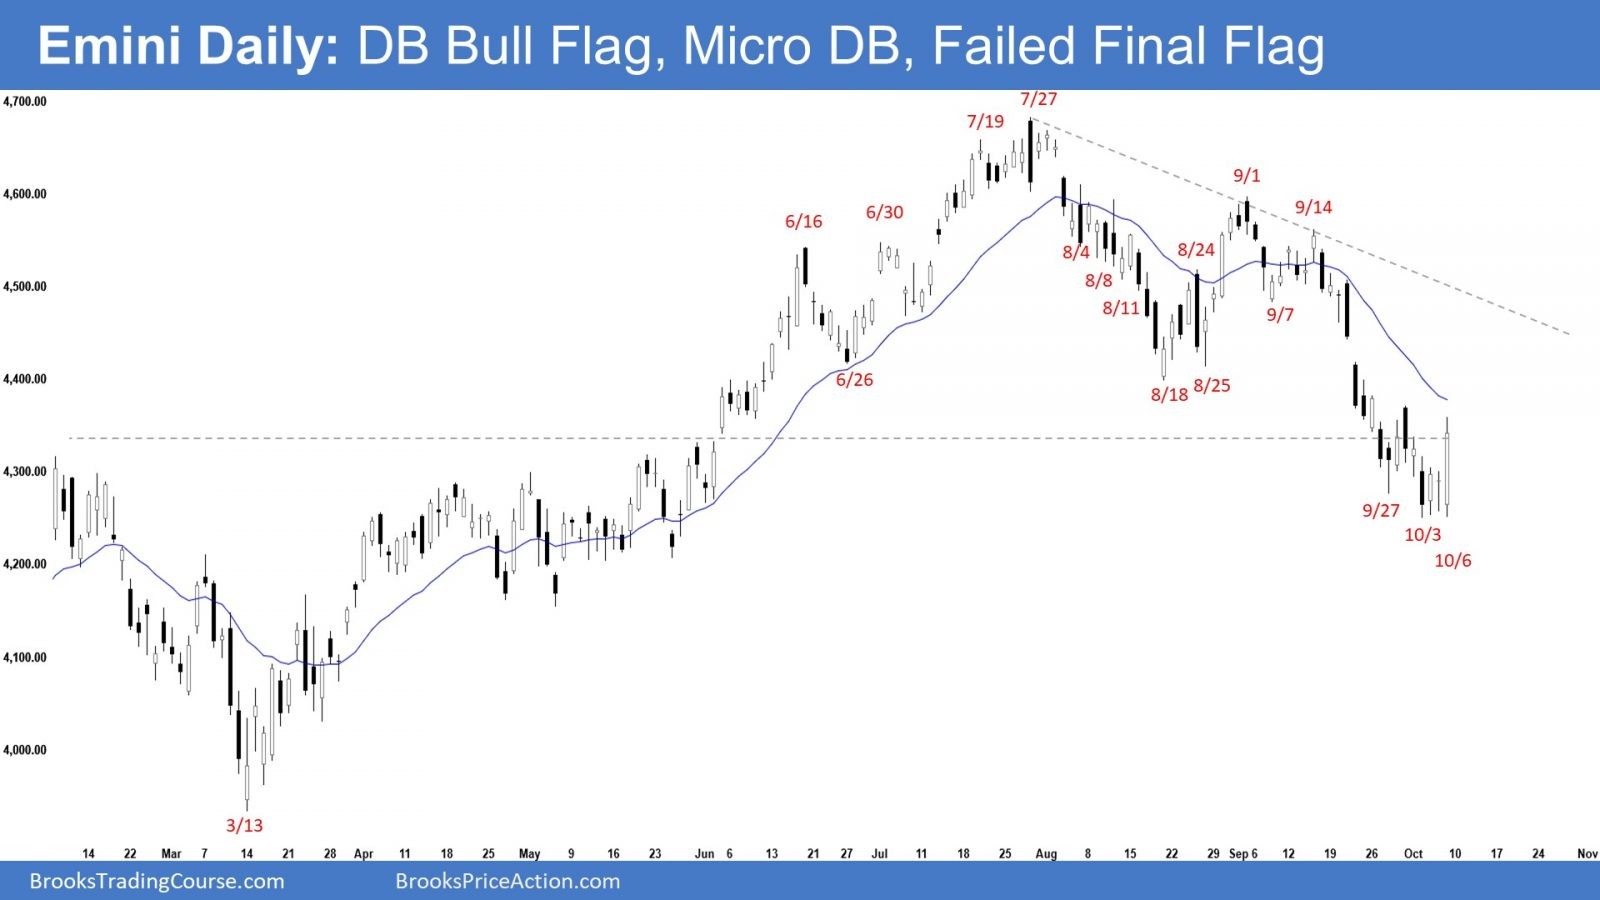 S&P 500 Emini-Daily Chart
- The market traded slightly lower early in the week followed by a sideways trading range forming an ii (inside inside pattern on Wednesday and Thursday. Friday broke below the ii pattern but reversed to break above it, closing as a big outside bull bar.
- Previously, we said that the market may still be in the sideways-to-down pullback phase. Traders will see if the bears can create follow-through selling or will the market trade slightly lower but find buyers around the February 2 high area.
- So far, the market is stalling around the February 2 high area.
- The bears got a second leg sideways to down from a lower high major trend reversal and a double top bear flag (Sept 1 and Sept 14).
- They got a 50% pullback of the move which started in March, testing the February 2 high which was the breakout point of the rally.
- If the market trades higher from here, they want another leg down completing the wedge pattern with the first two legs being August 18 and October 3.
- The bulls want a reversal up from a double bottom bull flag (Aug 18 and Oct 3), a micro double bottom (Oct 3 and Oct 6), and a failed final flag (Oct 6) followed by a retest of the July 27 high and a strong breakout above.
- They see the current move simply as a 50% pullback and a test of the breakout point (Feb 2) of the rally.
- The next targets for the bulls are the bear trend line and the September high.
- Since Friday was a big outside bull bar closing in its upper half, it is a buy signal bar for Monday.
- Odds slightly favor the Emini to trade at least a little higher.
- Traders will see if the bulls can create consecutive bull bars closing near their highs. If they get that, the odds of a retest of the September high increase.
- Or will the market trade slightly higher but is weak and sideways (overlapping bars, doji(s), bear bars)? If it is weak, the odds of a retest of the current leg low (Oct 3) increase.
- For now, while the market may still trade sideways to down for a few more weeks, the bull trend remains intact.