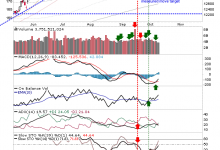
S&P 500: E-Mini Testing August 18 Low
S&P Emini Pre-Open Market Analysis
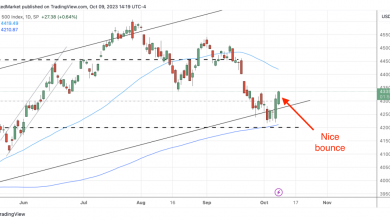
- The S&P 500 Futures is forming a bottom and is testing the August 18th low.
- I have been saying for the past few weeks that the Emini will probably test the August 18th breakout point low due to trapped bulls.
- It was reasonable for the bulls to buy the breakout below the August 18th low and scale in lower, betting on a trading range.
- Traders will pay close attention to see how the market reacts to the August 18th low. The Bulls hope they can break far above the low, and the Bears want to keep the August 18th breakout point gap open. However, more likely, the gap is going to close.
- As strong as the selloff down to the October low appears, it is likely a complex two-legged pullback on a higher time frame. This means the odds favored a trading range forming, not a bear trend.
- It is possible that the selloff to the October low is a 2nd leg trap. The rally could be deep and go far above the August 18th low.
- The market might be Always In Long. However, the bulls have not done enough to make it Always In Long. Ideally, the bulls need to get 1-2 closes above the moving average before traders will be convinced they have taken control.
- However, the rally over the past two trading days is strong enough for the market to be Always In Long and likely to lead to higher prices.
- The bears want to trap the bulls by forming a strong bear trend bar. However, that would create a Low 1 short, and buyers would likely be below it.
What to Expect Today
- I am traveling in Europe and due to the time zone difference, I am writing this blog several hours before the open, and the market is only 10 points away from yesterday’s close.
- Traders should pay attention to the August 18th low as the market may try and reach it today or tomorrow.
- There is an 80% chance of a trading range open and only a 20% chance of a trend from the open.
- Most traders should consider waiting 6-12 bars before placing a trade. As mentioned above, there is an 80% chance of a trading range forming on the open.
- Traders should try and catch the opening swing that often begins before the end of the second hour after forming a double top/bottom or a wedge top/bottom.
- By waiting for one of the patterns mentioned above to form, a trader can enter on a stop entry, allowing them to have a great risk/reward setup.
- Because of the past two days forming strong bull trend bars on the daily chart, the downside is likely limited. It is possible today to create a pullback on the daily chart before the market reaches the August 18th low.
- Lastly, the most important thing in the open is being patient and ready for anything. A trader must be calm and never in denial of the price action in front of them.
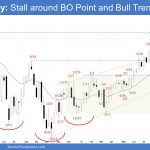
Yesterday’s Emini Setups Emini Daily Chart
Here are several reasonable stop-entry setups from yesterday. I show each buy entry with a green rectangle and each sell entry with a red rectangle. Buyers of both the Brooks Trading Course and Encyclopedia of Chart Patterns have access to a near 4-year library of more detailed explanations of swing trade setups (see Online Course/BTC Daily Setups). Encyclopedia members get current daily charts added to the Encyclopedia.
My goal with these charts is to present an Always In perspective. If a trader was trying to be Always In or nearly Always In a position all day, and he was not currently in the market, these entries would be logical times for him to enter. These therefore are swing entries.
It is important to understand that most swing setups do not lead to swing trades. As soon as traders are disappointed, many exit. Those who exit prefer to get out with a small profit (scalp), but often have to exit with a small loss.
If the risk is too big for your account, you should wait for trades with less risk or trade an alternative market like the Micro Emini.