S&P 500 Rally Pauses at Key Resistance: Fed Minutes, Key Data in Focus
The S&P 500 finished about 50 bps today higher but had been up more than 1% at one point—stocks turnaround after 1 p.m. ET, following a weak 3-Year Treasury auction.
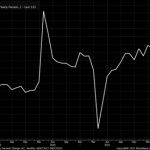
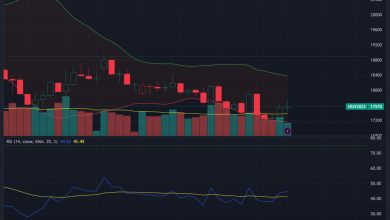
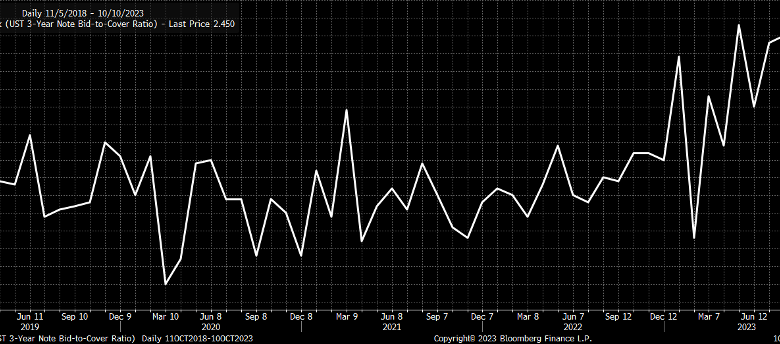
The 3-year auction ended up tailing, with a when-issued rate of 4.723% while pricing at 4.74%. The bid-to-cover ratio plunged to 2.56, down sharply from last month and the lowest since February.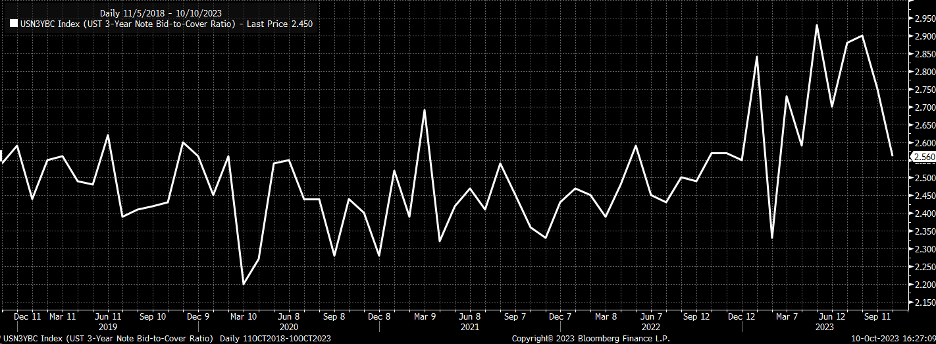 SPX-Bid-to-Cover-Daily Chart
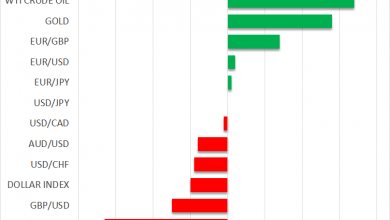
Why the 10-Year Yield Fell Yesterday
That will place extra attention on the 10-year auction today at 1 p.m., which will come after the PPI report in the morning and ahead of the CPI report on Thursday morning. That will be followed by a 30-year auction on Thursday afternoon.
The 10-year fell yesterday to around 4.65%, basically where it was on October 2, and back to its support region. This is a significant region because if the 10-year continues to hang around this 4.65% to 4.7%, and rates do not break down further, it will tell us that rates will likely continue on their path higher.
Today will also be the Fed minutes, and I will pay close attention to how rates on the long end of the curve respond to those minutes. The minutes are likely to reflect that “the Fed is close to being done on the rate hikes, but that will stay higher for a long time” approach. If we get long-end rates bouncing higher tomorrow, the curve’s long end may tell us that monetary policy is not tight enough. 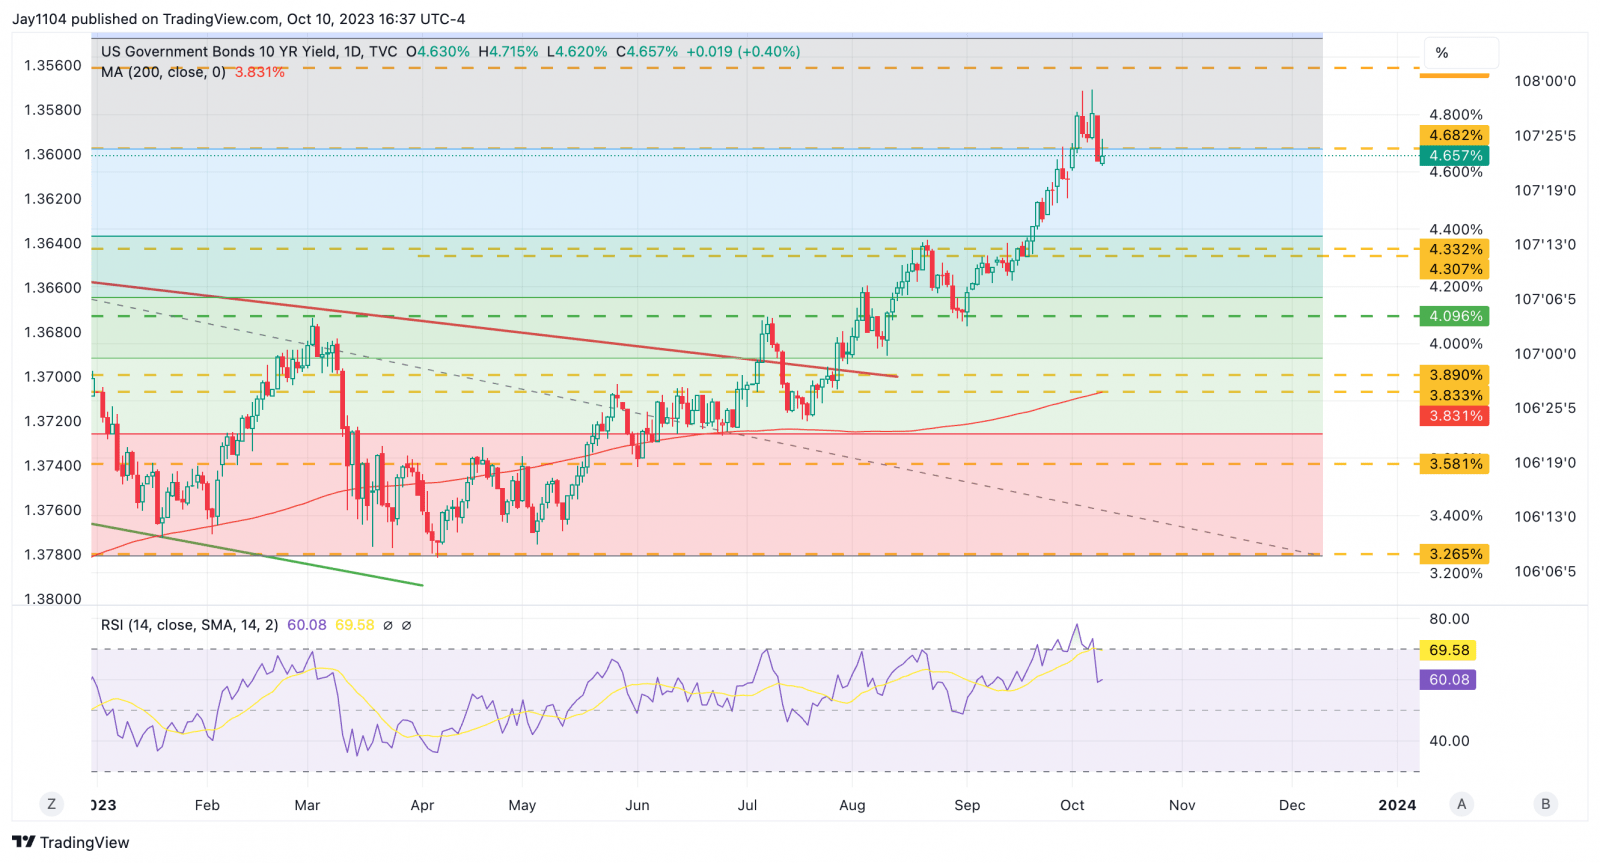 US 10-Yr Yield-Daily Chart
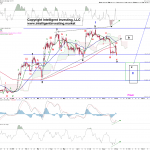
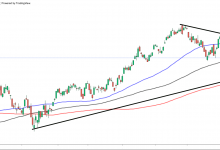
S&P 500 Reaches a 100% Extension of Wave
I noted in a mid-day video and write-up that the S&P 500 had reached a 100% extension of wave A right around 1 p.m. ET. So, if the rally wants to be over, it may already have hit the spot.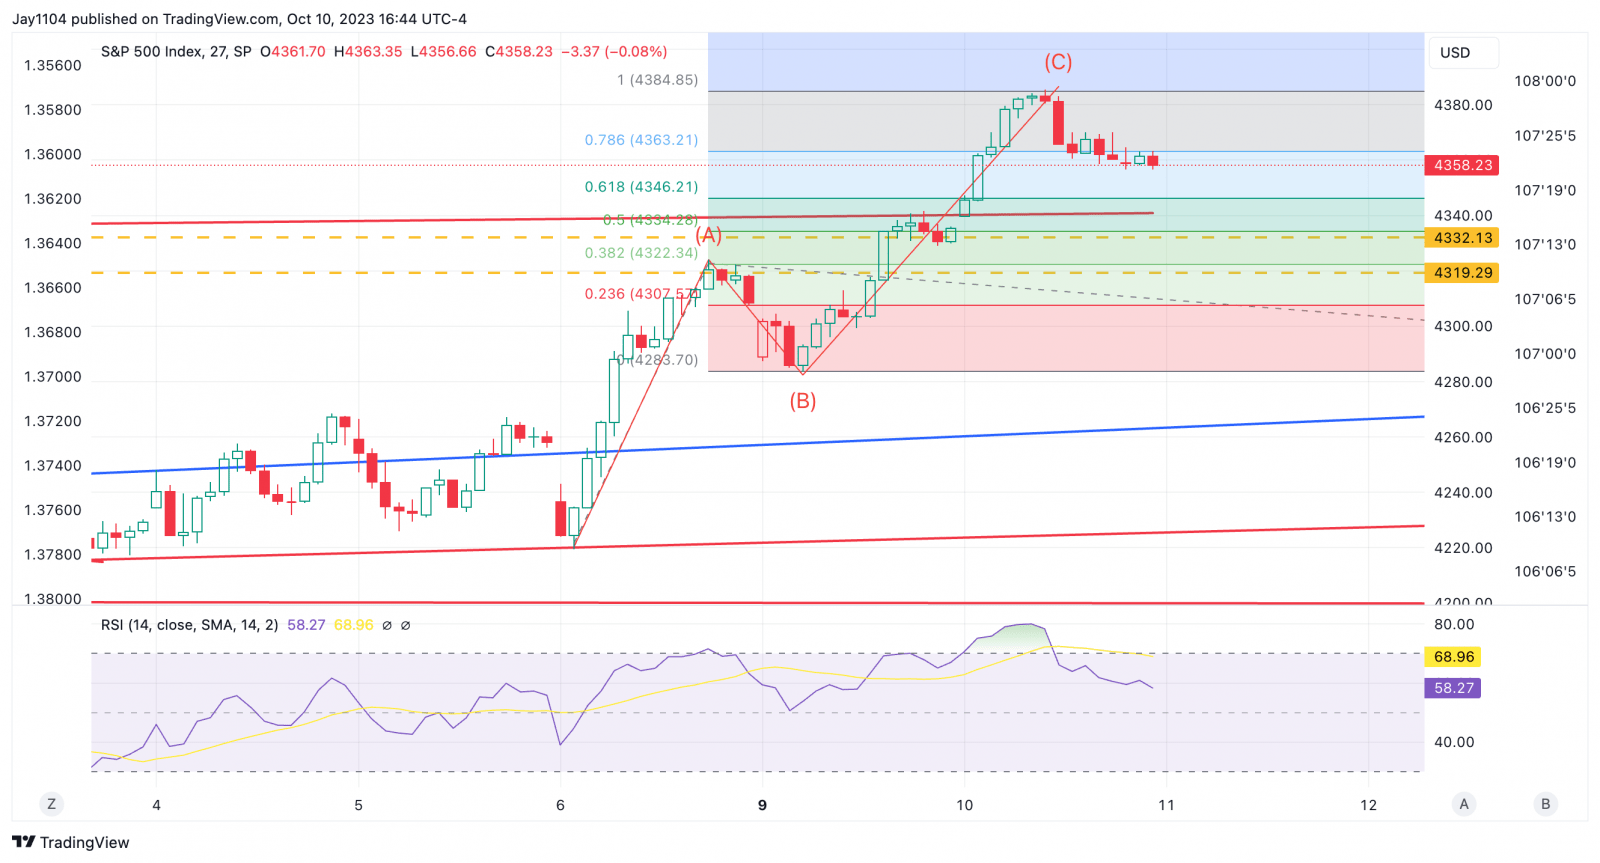 SPX Index Chart
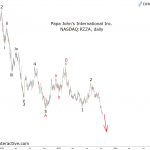
It is also possible that the retracement of the past three days was the end of wave four up, and today’s high marked the start of wave five lower. We must surpass 4,386 to invalidate that wave count on the S&P 500.
Yesterday’s rally drew the index to around a 38.2% retracement of the decline since July 27. Additionally, the candle from today’s make a nice reversal candle. If the index gaps up tomorrow and takes out the highs at 4,386, we probably rally to 4,400 in the days ahead.
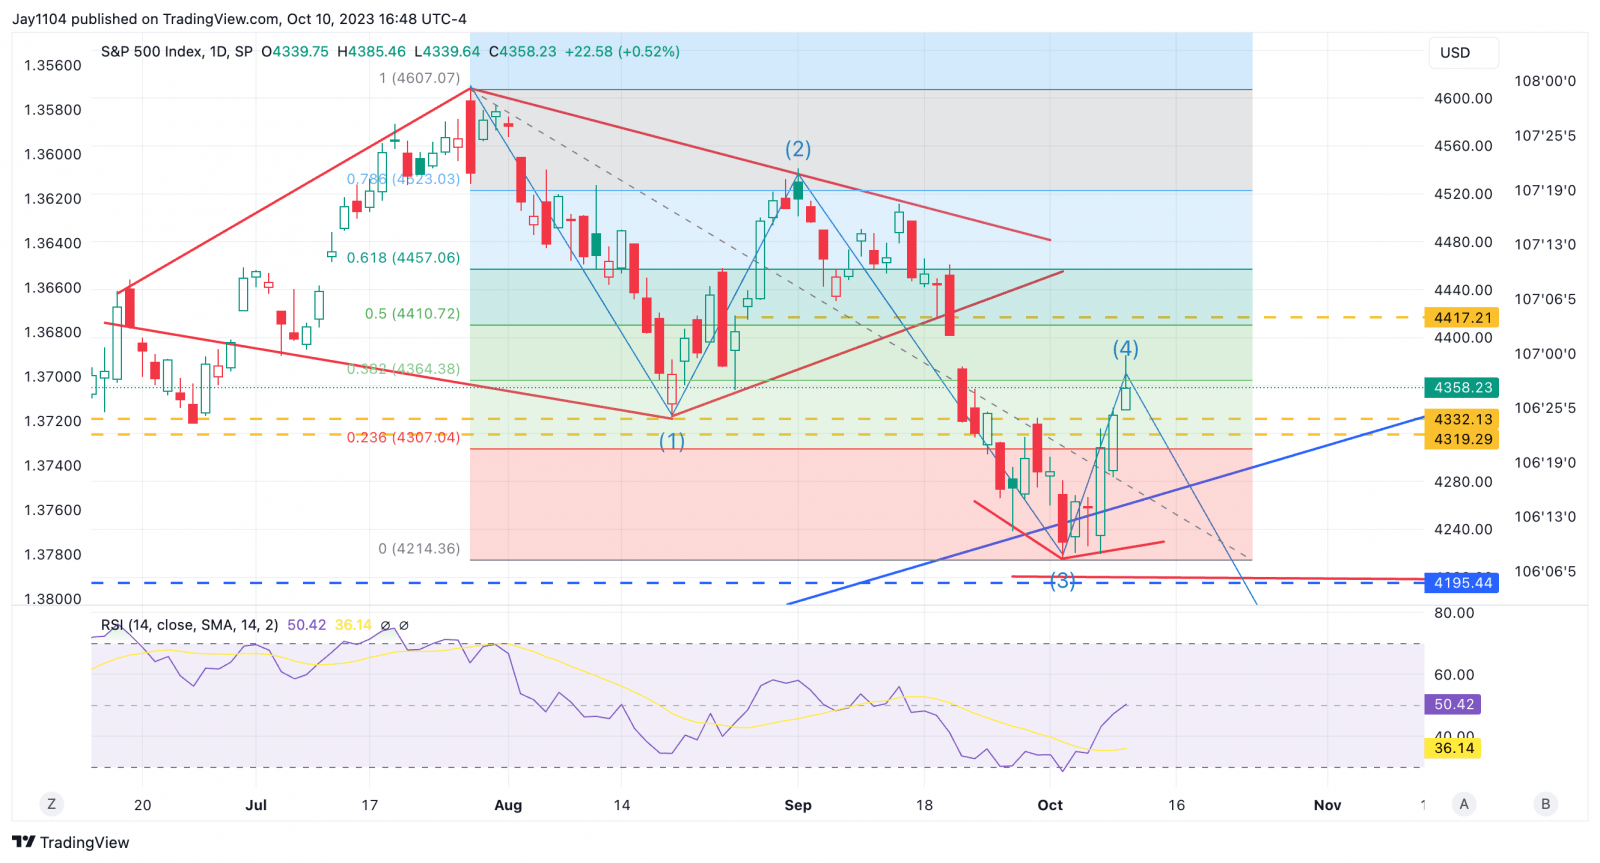 S&P 500-Daily Chart
Apple Put in a Reversal Candle
Apple (NASDAQ:AAPL) appears to have put in a reversal candle when it traded higher to $179.72, which took out the highs of September 19, 20, and October 9 and then managed to close under all of those highs.
The October 9 high probably matters the most, as well as the shares failing at their 50-day moving average. I will be watching now to see if we can break lower, which could mean a retest of those witnessed at the end of September.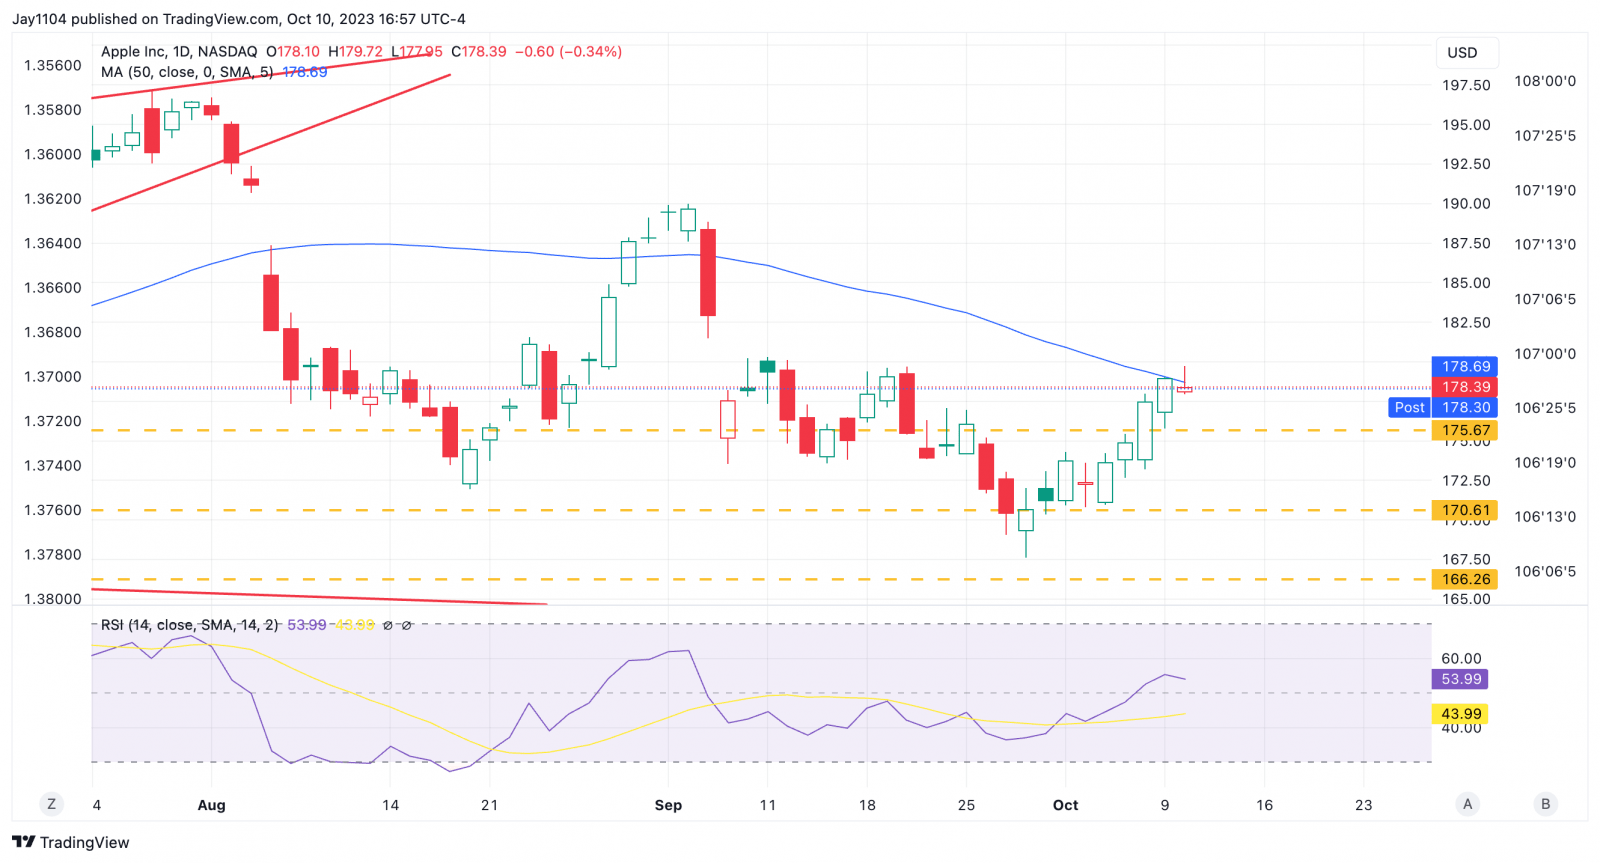 Apple Inc-Daily Chart