Natural Gas: The Uptrend Continues – Where Next for the Commodity?
Natural Gas Futures on the Nymex advanced spectacularly during the week, closing 13.6% higher than the previous one at $3.33. EIA reported on Thursday a rather bullish build for this time of year of only 86 Bcf in working underground stocks for the week ended September 29. Total inventory is currently at 3,445 Bcf, 11.6% higher y/y, but now only 5.3% above the 5-year average.
The market offered us another buying opportunity on an anticipated spike activity on the near-term charts on directional trading we have been operating on in the past few months. The seasonal uptrend continues as the November contract is trading on larger volumes after months of exhaustion.
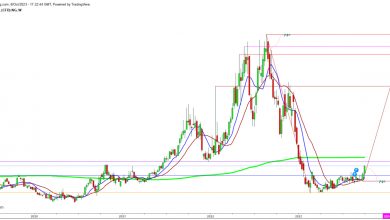
The average rate of injections into storage has been 7% lower than the 5-year average, only a month before the withdrawal season begins. We must also anticipate a definite delay before larger volumes are being withdrawn. The uptrend continues as price is reaching for higher highs, but we must be remaining vigilant from now on and anticipate a seasonal ceiling for the winter contracts. Maybe around $4.50.
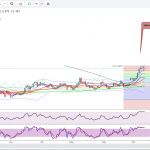
The Daily MACD crossed bullish late September and here we are already looking at an overbought 4hour chart. So, we might want to take a breather before starting to buy again.
Because of the Fed’s latest policy on inflation, or a no policy as a couple of oligopolies creating all the inflation remain unregulated, we expect large trading volumes on hedging activity because of end-of-year trading across other assets from different market participants on the Big Board. The market will remain in uptrend although volatile for another couple of months. There are a few states that will want to buy early larger volumes for the February contract. The rate of withdrawals later in December will have fresh impact on pricing.
The situation in Israel is very concerning as the whole area is a hub of great interest for Europe, especially in Natural Gas volumes. U.S. macro data and the Dollar Index must be monitored routinely. Daily, 4hour, 15min MACD and RSI are pointing to entry areas.
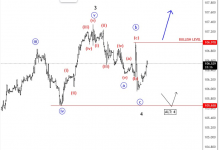
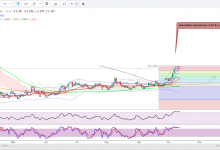
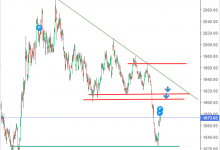
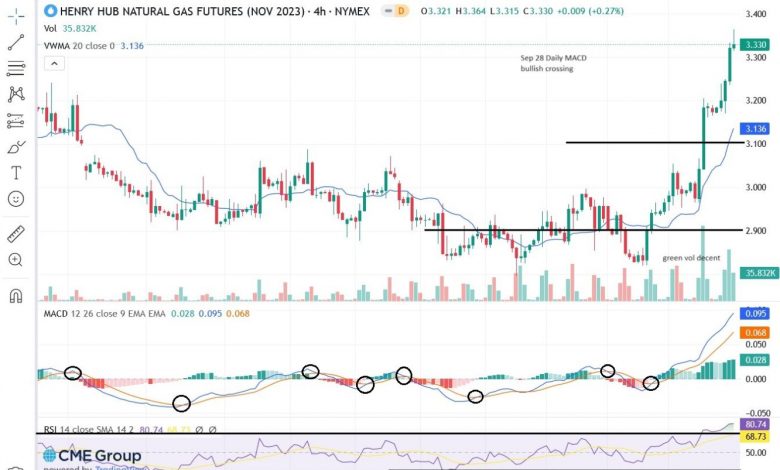
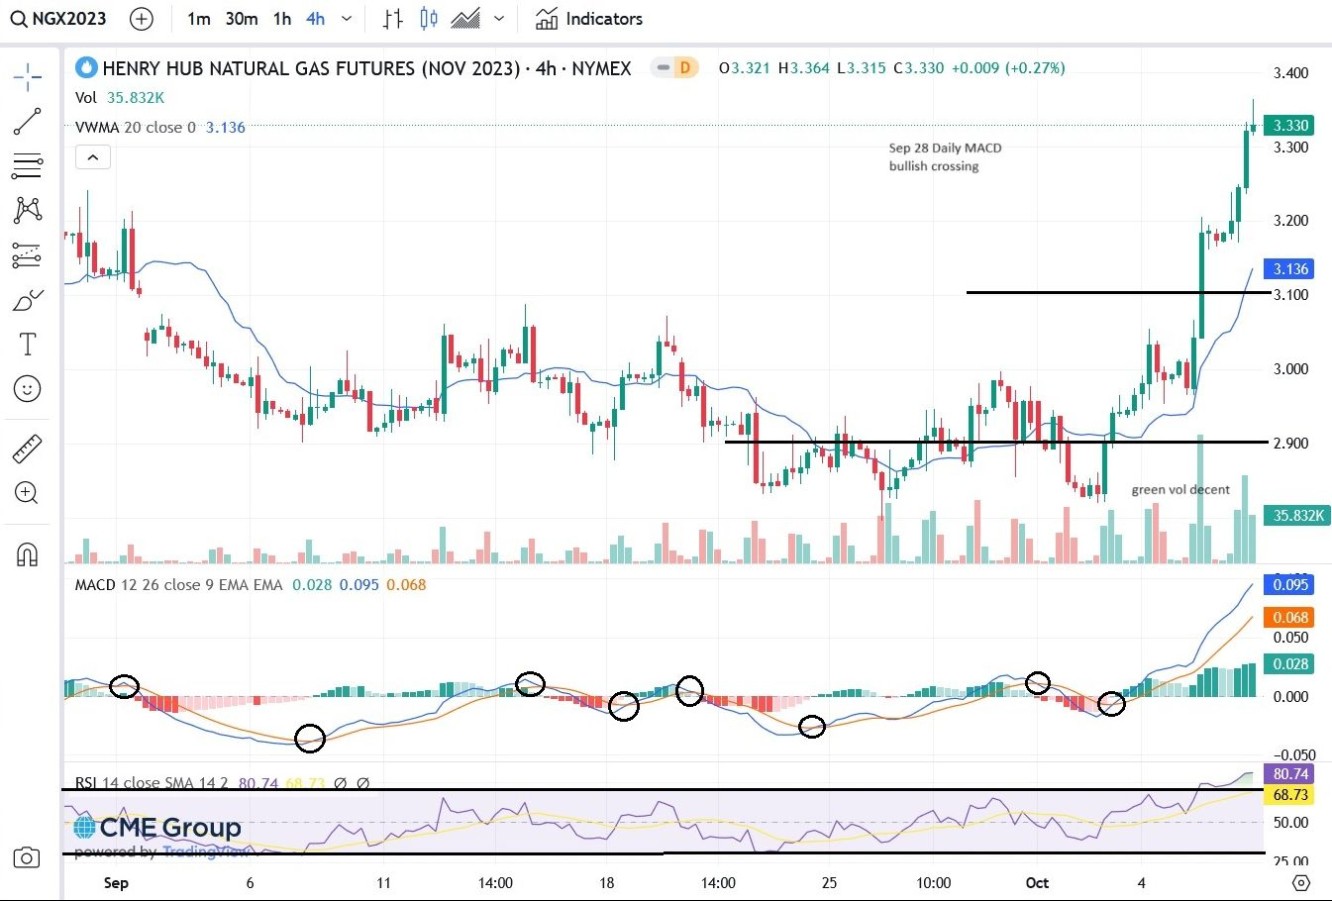 Nat Gas 4-H Chart