Natural Gas: Bulls Flex Muscles as Commodity Soars Above $3
Since my last analysisnatural gas futures have remained exceptionally volatile due to various concerns surrounding supply and demand. Without a doubt, the bulls demonstrated their strength by holding above the long-standing resistance level of $3 just last Friday.
Looking ahead, the potential for an impending winter blast, combined with the likelihood of production cuts driven by increasing inflationary pressures, is poised to favor further breakout movements in the weeks to come.
Conversely, a decrease in rig counts in the coming weeks could also contribute to natural gas futures experiencing additional upside breakouts.
Natural gas has defied market trends, with the weather outlook shifting from hot to cold. The EIA reports indicate that U.S. natural gas exports reached a record high in the first half of 2023, further fueling optimism among natural gas bulls.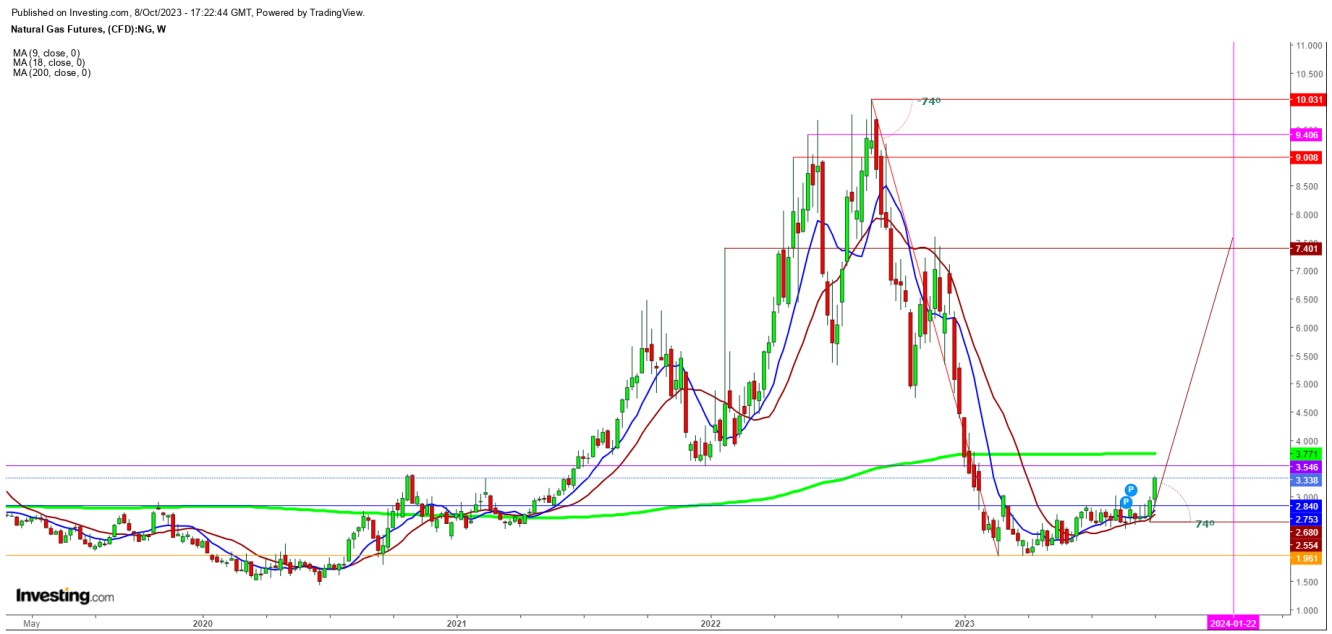 Natural Gas Futures Weekly Chart
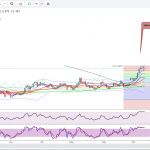
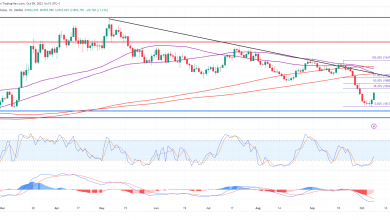
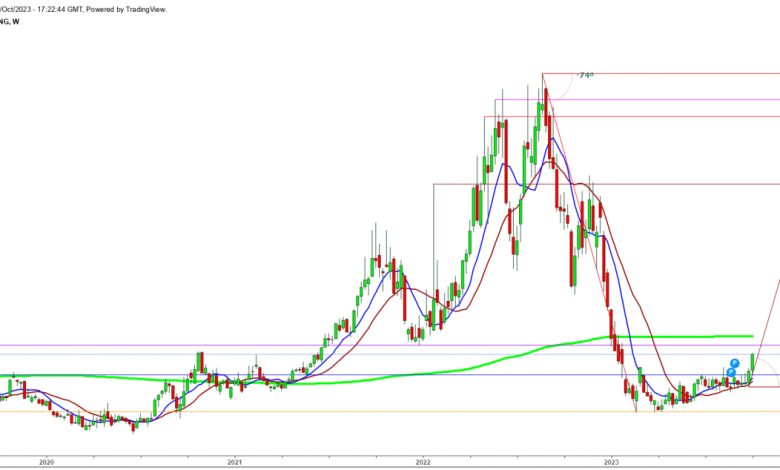
Upon analyzing the price movements of natural gas on the weekly chart, I’ve observed an intriguing application of trigonometric principles: the angle of elevation appears to mirror the angle of depression.
In August 2022, natural gas futures began a decline from their peak at $10, following a steep 74-degree angle of depression.
Subsequently, since the conclusion of this downward slope in the third week of February 2023, natural gas futures have been trading consistently around the $1.961 base price, with average price fluctuations hovering around $2.5. Then, during the fourth week of February 2023, they experienced a sudden surge to $3.028, followed by simultaneous sell-offs.
Once again, during the first week of October 2023, a breakout above the level reached in the fourth week of February indicated the initiation of an equal-degree angle of elevation, namely 74 degrees. In simpler terms, if the weekly chart shows an equally bullish candlestick pattern, it may confirm the continuation of the current uptrend.
Without a doubt, should natural gas futures maintain this consistent 74-degree angle of elevation, they could potentially retest the highs at $7.552 during the third week of January 2024.
In summary, the immediate resistance for natural gas futures on the weekly chart stands at the 200 Days Moving Average, currently at $3.771. A breakthrough beyond this significant resistance level in the upcoming week would affirm the persistence of this seasonal uptrend, especially as the put/call open interest ratio for natural gas November futures is at 0.77, signaling the potential for further breakouts
***
Disclaimer: