Nasdaq, S&P 500 Hold Onto Weekly Support; Russell 2000 in Trouble: Technical View
Friday’s surge on daily time frames set up solid finishes on weekly time frames for the Nasdaq and S&P 500, while the Russell 2000 (IWM) remains in trouble.
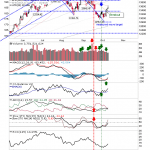
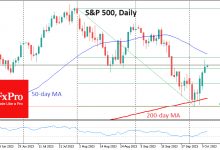
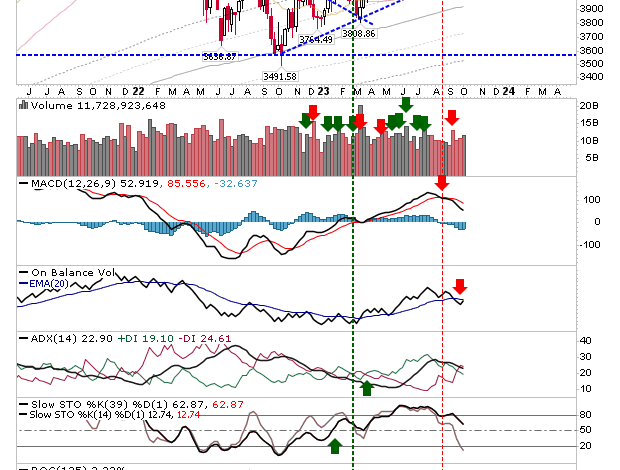
The S&P 500 has posted a ‘bullish’ hammer on 4,275 support, although the reversal potential of this candlestick is reduced by intermediate-term momentum caught in a bit of no-mans land, but short-term momentum is oversold and volume registered as accumulation. What the strong finish has also done is set up a new relative performance high against Small Caps via the Russell 2000 ETF ($IWM).
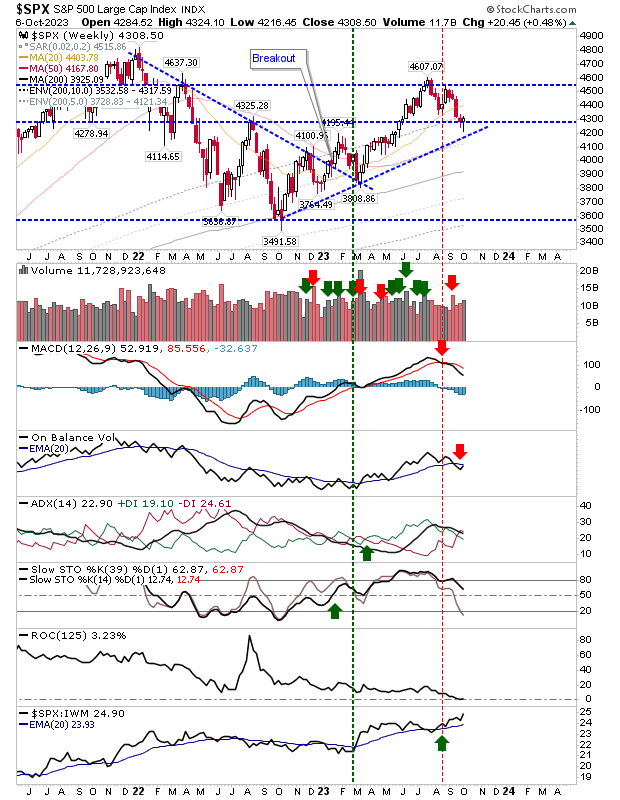 SPX-Weekly Chart
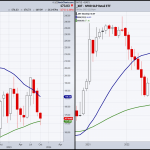
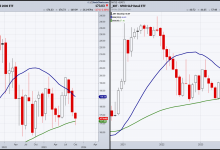
The Nasdaq has also rallied from 13,000 support and has a number of convergences working in its favor. There is certainly room for a challenge on the last swing high at 14,445, and if it was to make it there, then I would be looking for much more. There are some other positives, notably the new ‘buy’ trigger in On-Balance-Volume.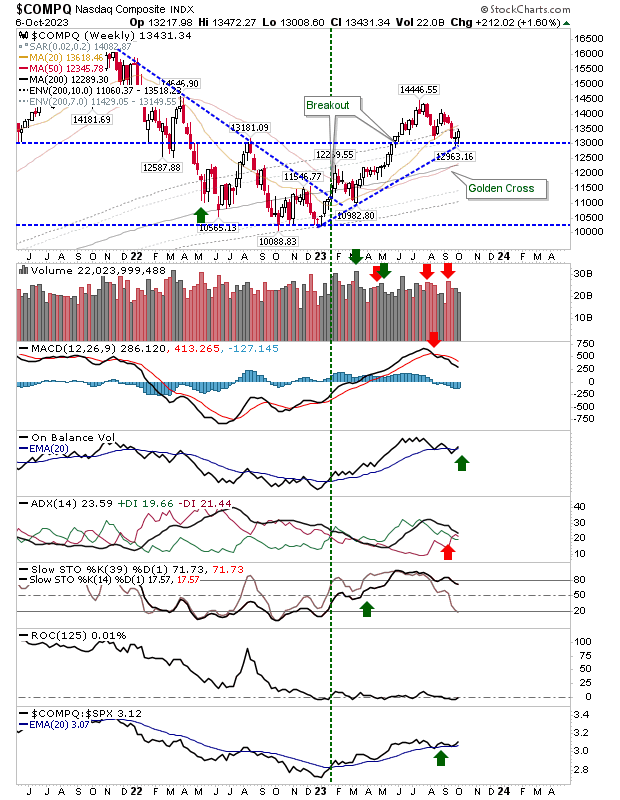 COMPQ-Weekly Chart
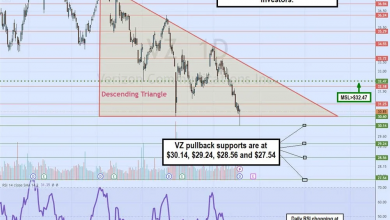
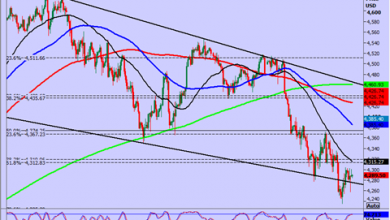
The ugly duckling remains the Russell 2000 ($IWM). There is support around $160s, but in the $170s there isn’t much to work with. It would be a stretch to consider Friday’s candlestick as bullish, and volume counted as distribution. Supporting technicals are net bearish. At best, it’s neutral. In reality, this is still in a bearish downtrend.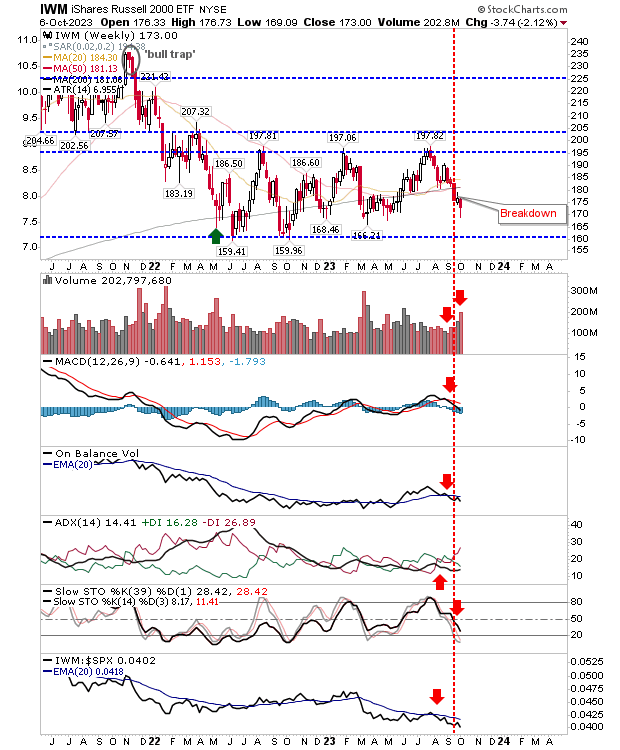 IWM-Weekly Chart
If you read this in time, there is probably a good support buy for the Nasdaq (via $QQQ) or S&P (via the $SPY) to hold on a multi-week basis, not as a trade on a daily timeframe.