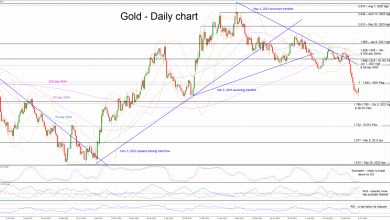
Gold Forms Potential Bottom Amid Mideast War
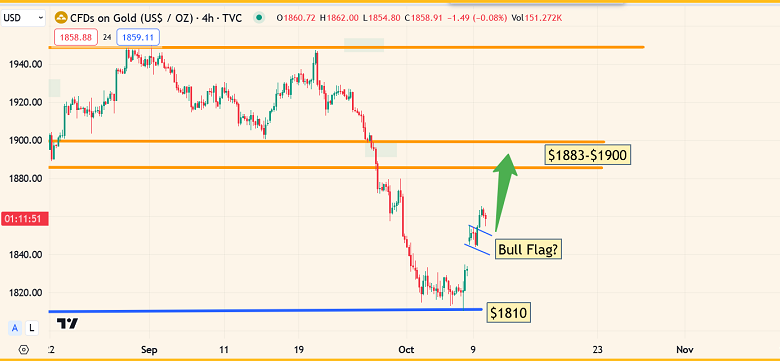
Is it a coincidence that the next big phase in the 2021-2025 war cycle (Israel/Gaza) began precisely as gold hit my massive $1810 buy zone?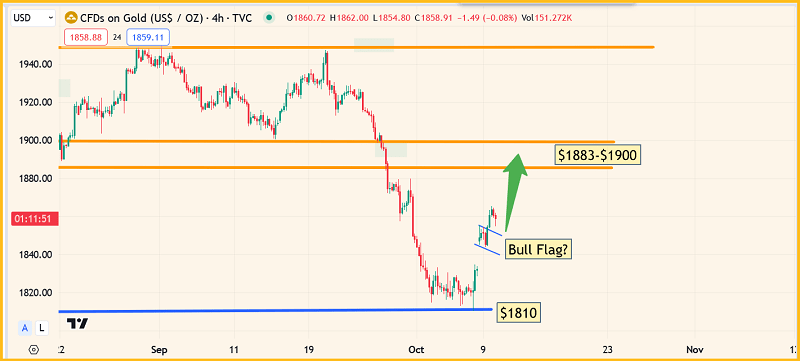 CFDs on Gold
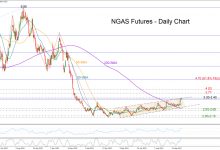
The stunning short-term gold chart.
I urged gold bugs of the world to step up to the buy plate as gold approached $1810 and to do it with an “” approach, meaning buy gold, silver, and the miners aggressively.
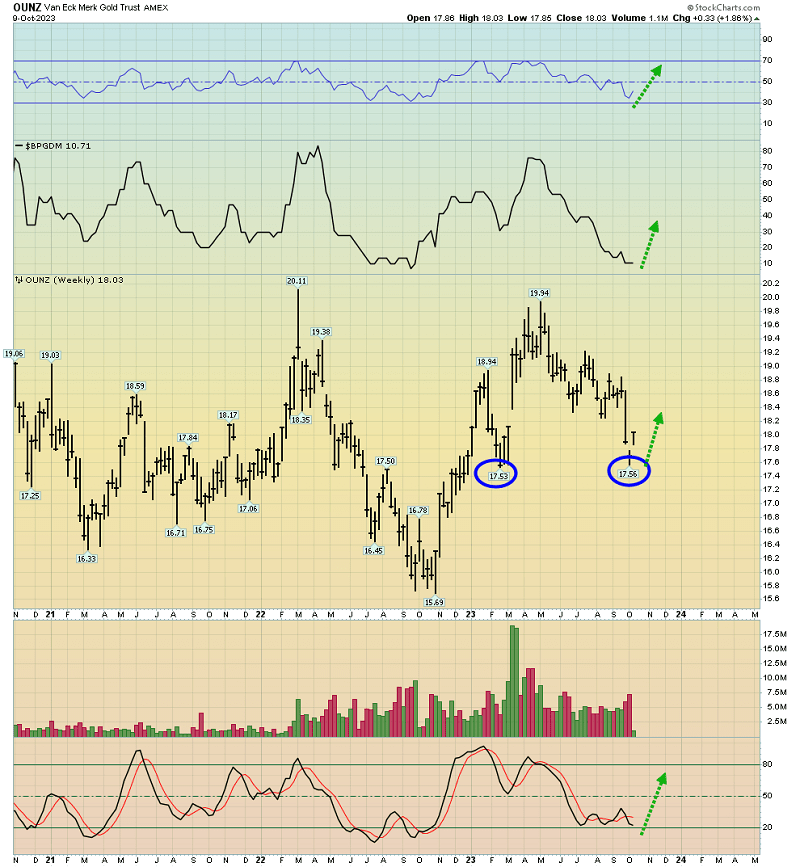 OUNZ-Weekly Chart
Investors who bought are likely now in a and could stay there for many months to come. A look at the weekly gold chart basis OUNZ-AMEX. The $17.50 zone is the equivalent of $1810 gold in the cash market.
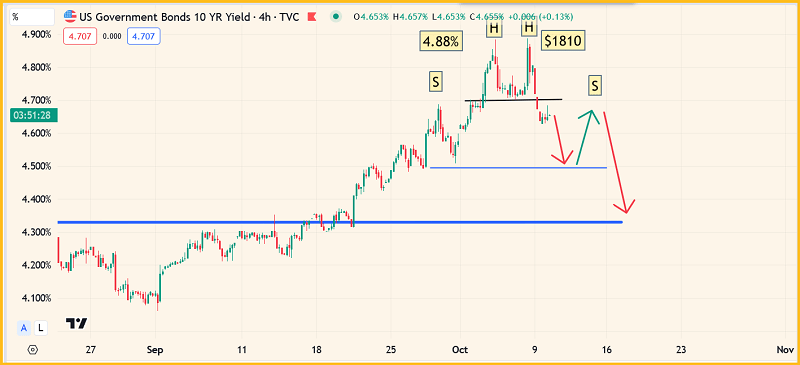 US 10-Year Yield-4-Hour Chart
The bearish interest rates chart. The 10-year bond/note has a “” double-top pattern.
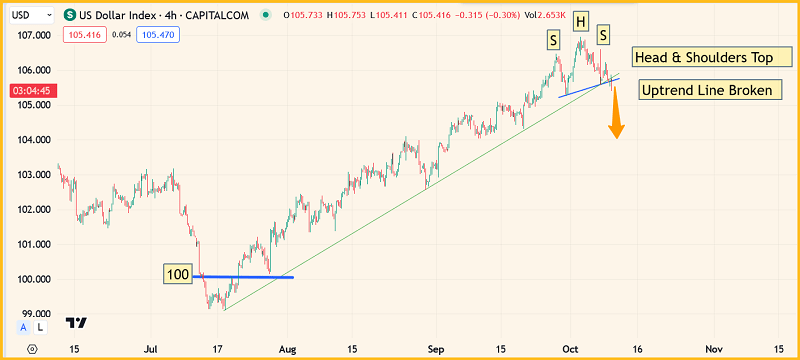 US Dollar Index-4-Hour Chart
A look at the rate-dependent DXY dollar index. With Israeli and Gaza “” preparing for a long, long war, gold could mirror the action with a big rally.
To say thatis probably a significant understatement of the current situation.
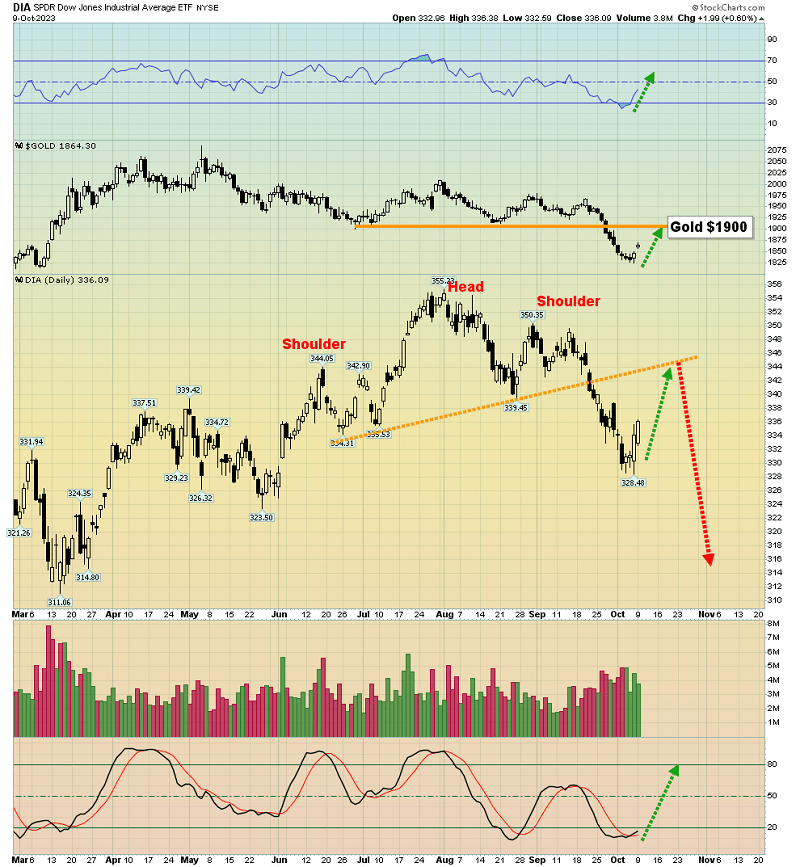 DIA-Daily Chart
What about the stock market? Both stocks and gold look set to rally as rates sink and the dollar collapses. A rally back to the H&S top neckline is likely for the Dow Jones and to $1900 for gold.
From there? Well, at that point gold is likely to pause while the stock market gets into trouble and begins a new and ominous leg down.
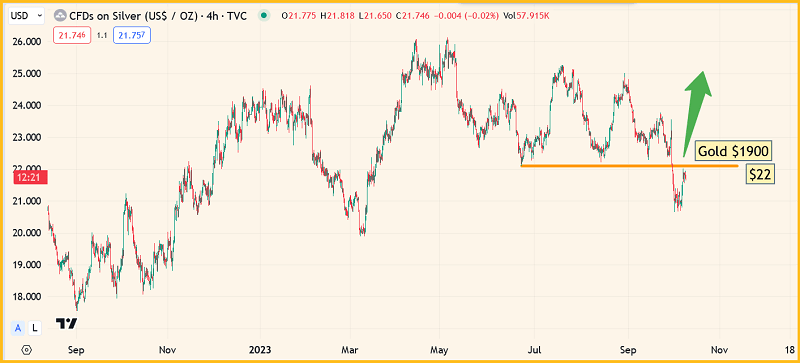 CFDs on Silver
A look at silver. While silver does best in an out-of-control inflation environment, it’s showing good performance versus gold as Israel and Gaza take the lead war cycle baton from Russia and Ukraine.
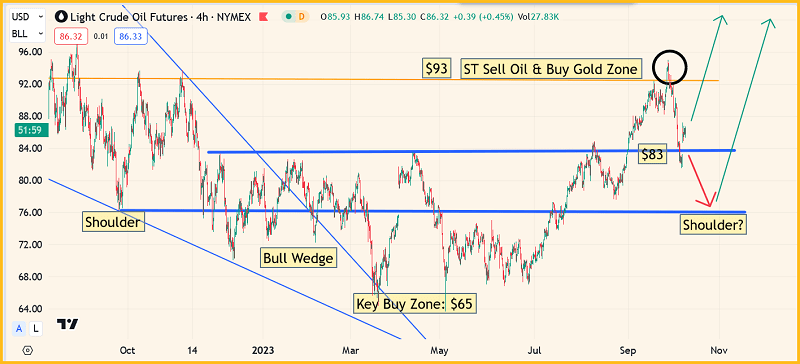 Crude Oil Futurres-4-Hour Chart
The action-packed |oil}} price chart. While I issued a call at $93 for oil and $1810 for gold, both oil and gold could be poised to soar; oil has built a high right shoulder as part of an ultra-bullish inverse H&S pattern.
What about the fundamentals? They are bullish too. One of America’s most maniacal war worshippers may be the nation’s president
Joe has been trying to get his Saudi counterparts to sign on to a “” that would include Israel and lots of weapons from America. In return, the Saudis would ramp up oil production to bring the price down.
Now, with Saudi arch-enemy Israel suddenly at war with Hamas in the Gaza strip, the Saudis could kill the deal. If they killed it publicly and with fanfare, oil could shoot past the key round number of $100
With “looking fabulous on her rally from $1810, gold stock bugs deserve some equally awesome technical action in the miners.
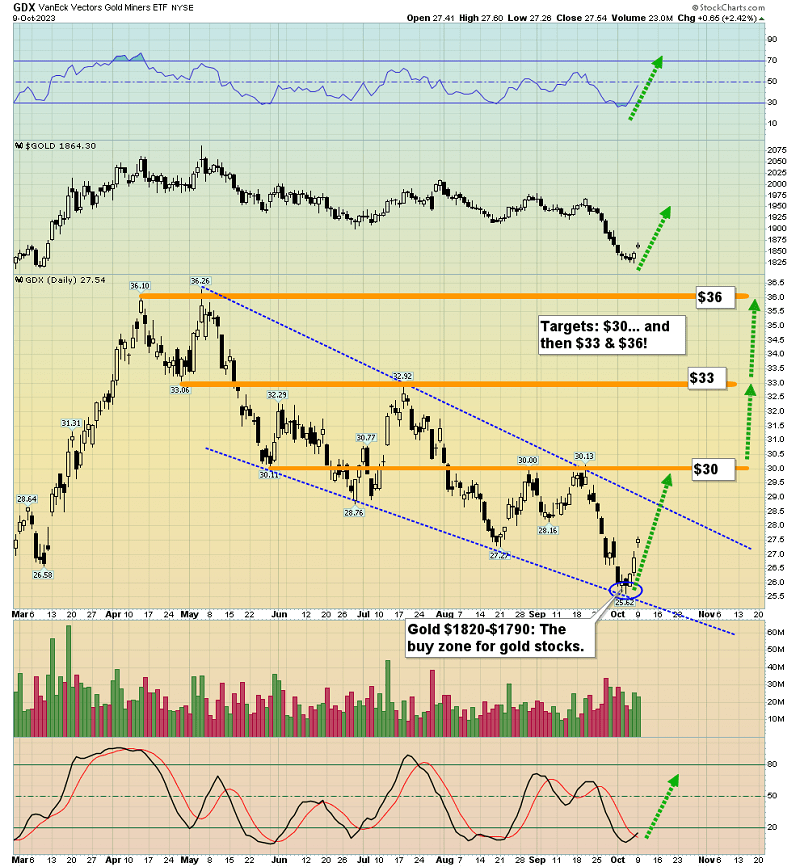 GDX-Daily Chart
The GDX (NYSE:GDX) daily chart. A surge to $36 looks increasingly likely.
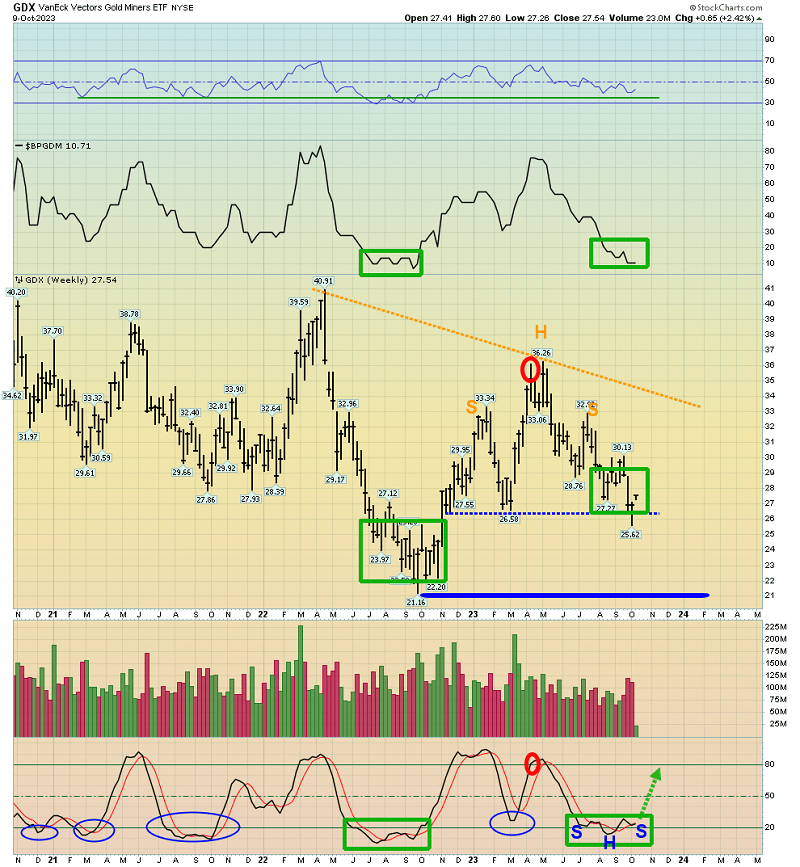 GDX-Weekly Chart
A look at the even more impressive weekly chart. Note the bullish oversold position (and inverse H&S pattern) on the Stochastics oscillator at the bottom of the chart.
If investors didn’t buy near my gold $1810 zone, is it too late to buy now? Well, the best time to buy is always when both the price and investor morale are weak. Buying high can be followed by emotional disappointment.
Having said that, the miners have not rallied excessively from the gold $1810 zone and Tuesdays are often a soft day for the price. Today is Tuesday. Investors may get a chance to buy their favorite miners a bit lower than yesterday’s closing price today.