Advance/Decline Line Warns Investors with Triple Top Breakdown
We have been highlighting several market indicators trading at critical time/price areas over the past month or so.
And today is no different as we take a look at the Advance/Decline Line for NYSE common stocks.

This is a very important measure of market breadth looking at the number of advancing versus declining stocks each day.
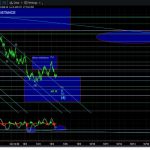
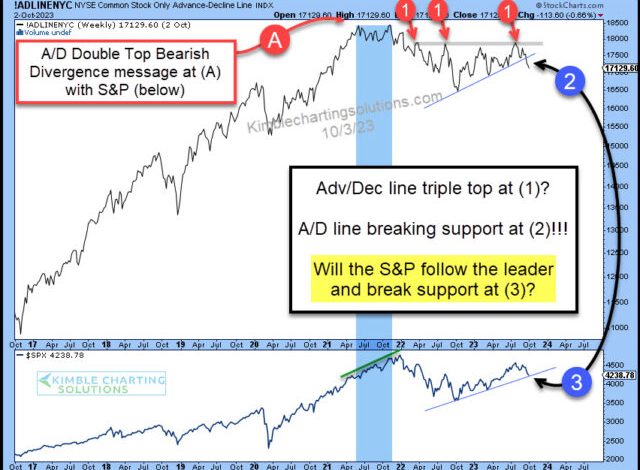
As you can see in the chart below, the Advance/Decline Line (A/D Line) created a double top (blue shade) before creating a triple top at (1). And now it is breaking down below support at (2). Yikes!
Looking at the lower pane in the chart, I humbly ask, “will the S&P 500 follow the leading indicator and break support at (3)???
Could the A/D Line be sending a new message to the markets with its breakdown at (2)? Stay tuned.