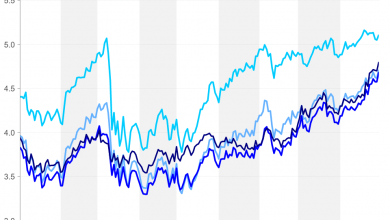
US 10-Year Bond Yield Could Be About to Top Out
When we previously wrote about the 10-year government bond yield in mid-February, when it was hovering around 3.75%. Elliott Wave analysis led us to believe that it could reach the 5% mark.
Less than eight months later now, the Fed’s “higher for longer” mantra has already pushed the yield an entire percentage point higher to ~4.75%. So perhaps now is a good time for an update.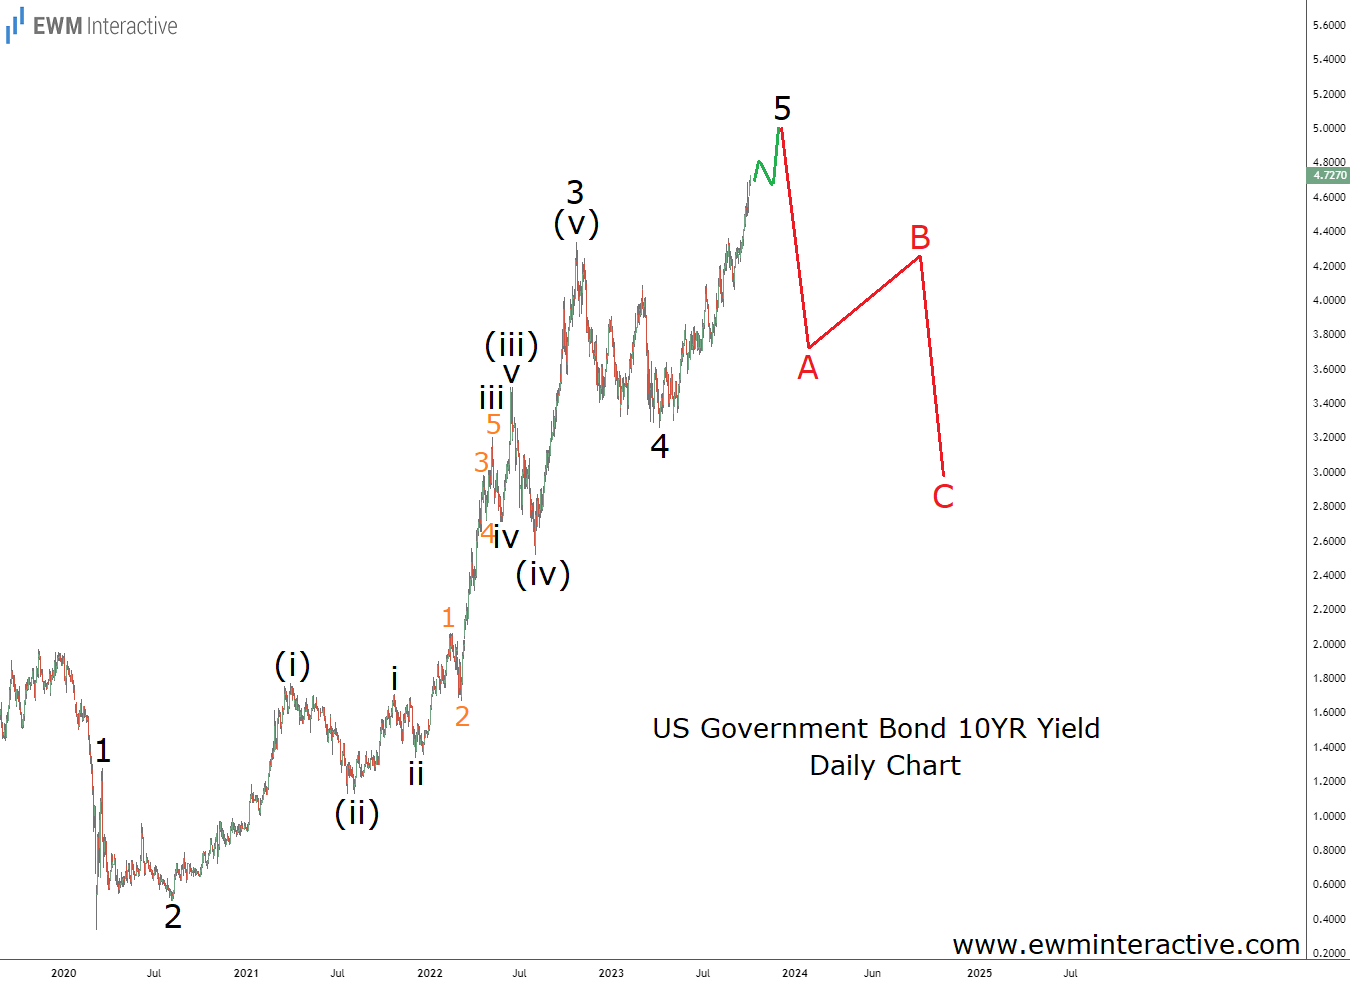 US 10-Year Bond Yield-Daily Chart
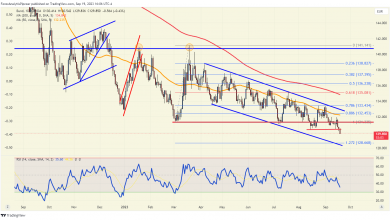
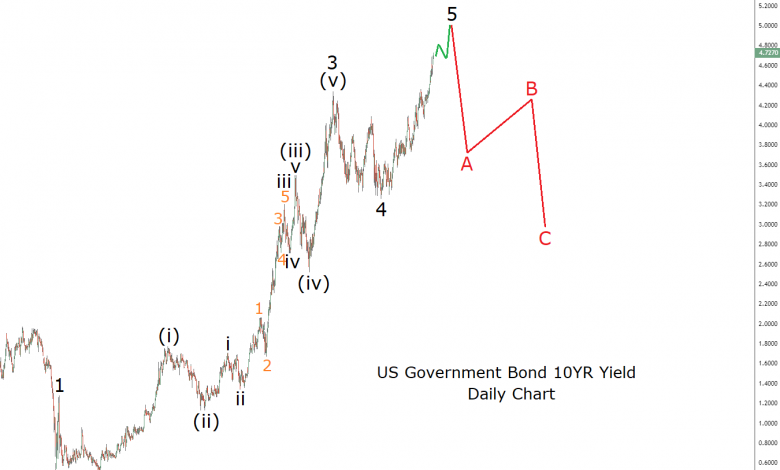
A close look at the daily chart of the US10Y bond yield reveals that it is on the verge of completing a five-wave impulse. The pattern began from 0.3330% in March 2020, and is labeled 1-2-3-4-5. The five sub-waves of wave 3 are also visible and marked (i)-(ii)-(iii)-(iv)-(v). Another two lower degrees of the trend can be recognized within the structure of wave (iii) of 3.
If this count is correct, the surge from the bottom in April must be the fifth and final wave of the sequence. According to the theory, a three-wave correction follows every impulse. So once wave 5 is over, somewhere near the 5% mark, we can expect a bearish reversal to trigger a notable retracement back to the support of around 3%.
The Fed may be in control of short-term interest rates, but the yield on long-dated Treasuries are determined by market forces. Who knows, maybe a recession or some other unforeseen event would occur and force the Fed to lower the entire yield curve again. What the exact catalyst will be is impossible to predict. But Elliott Wave analysis is already giving us a hint of what to expect from the US10Y bond. The same setup can be found on the charts of the 20-year and 30-year Treasuries, as well.