S&P 500: Can Nonfarm Payrolls Save the Market From Another Move Lower?
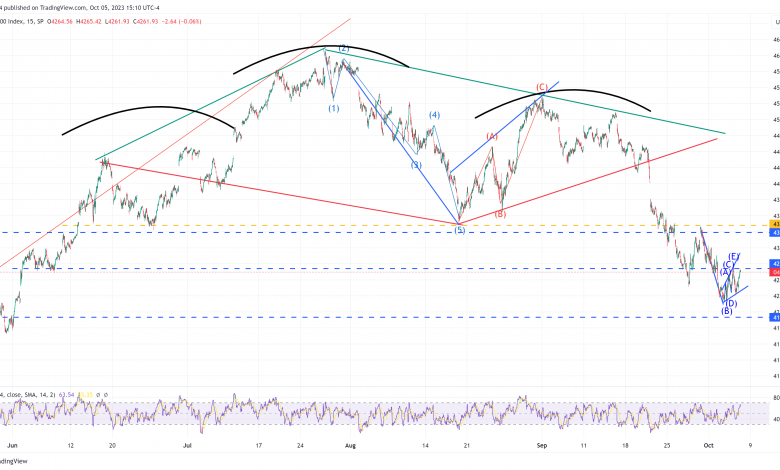
Stocks finished yesterday flat after being down earlier for most of the session. A sell-off in the dollar ahead of today’s Job report was the main catalyst for the bounce. The S&P 500, for the most part, has consolidated the last two trading sessions and failed for a second day at 4,270.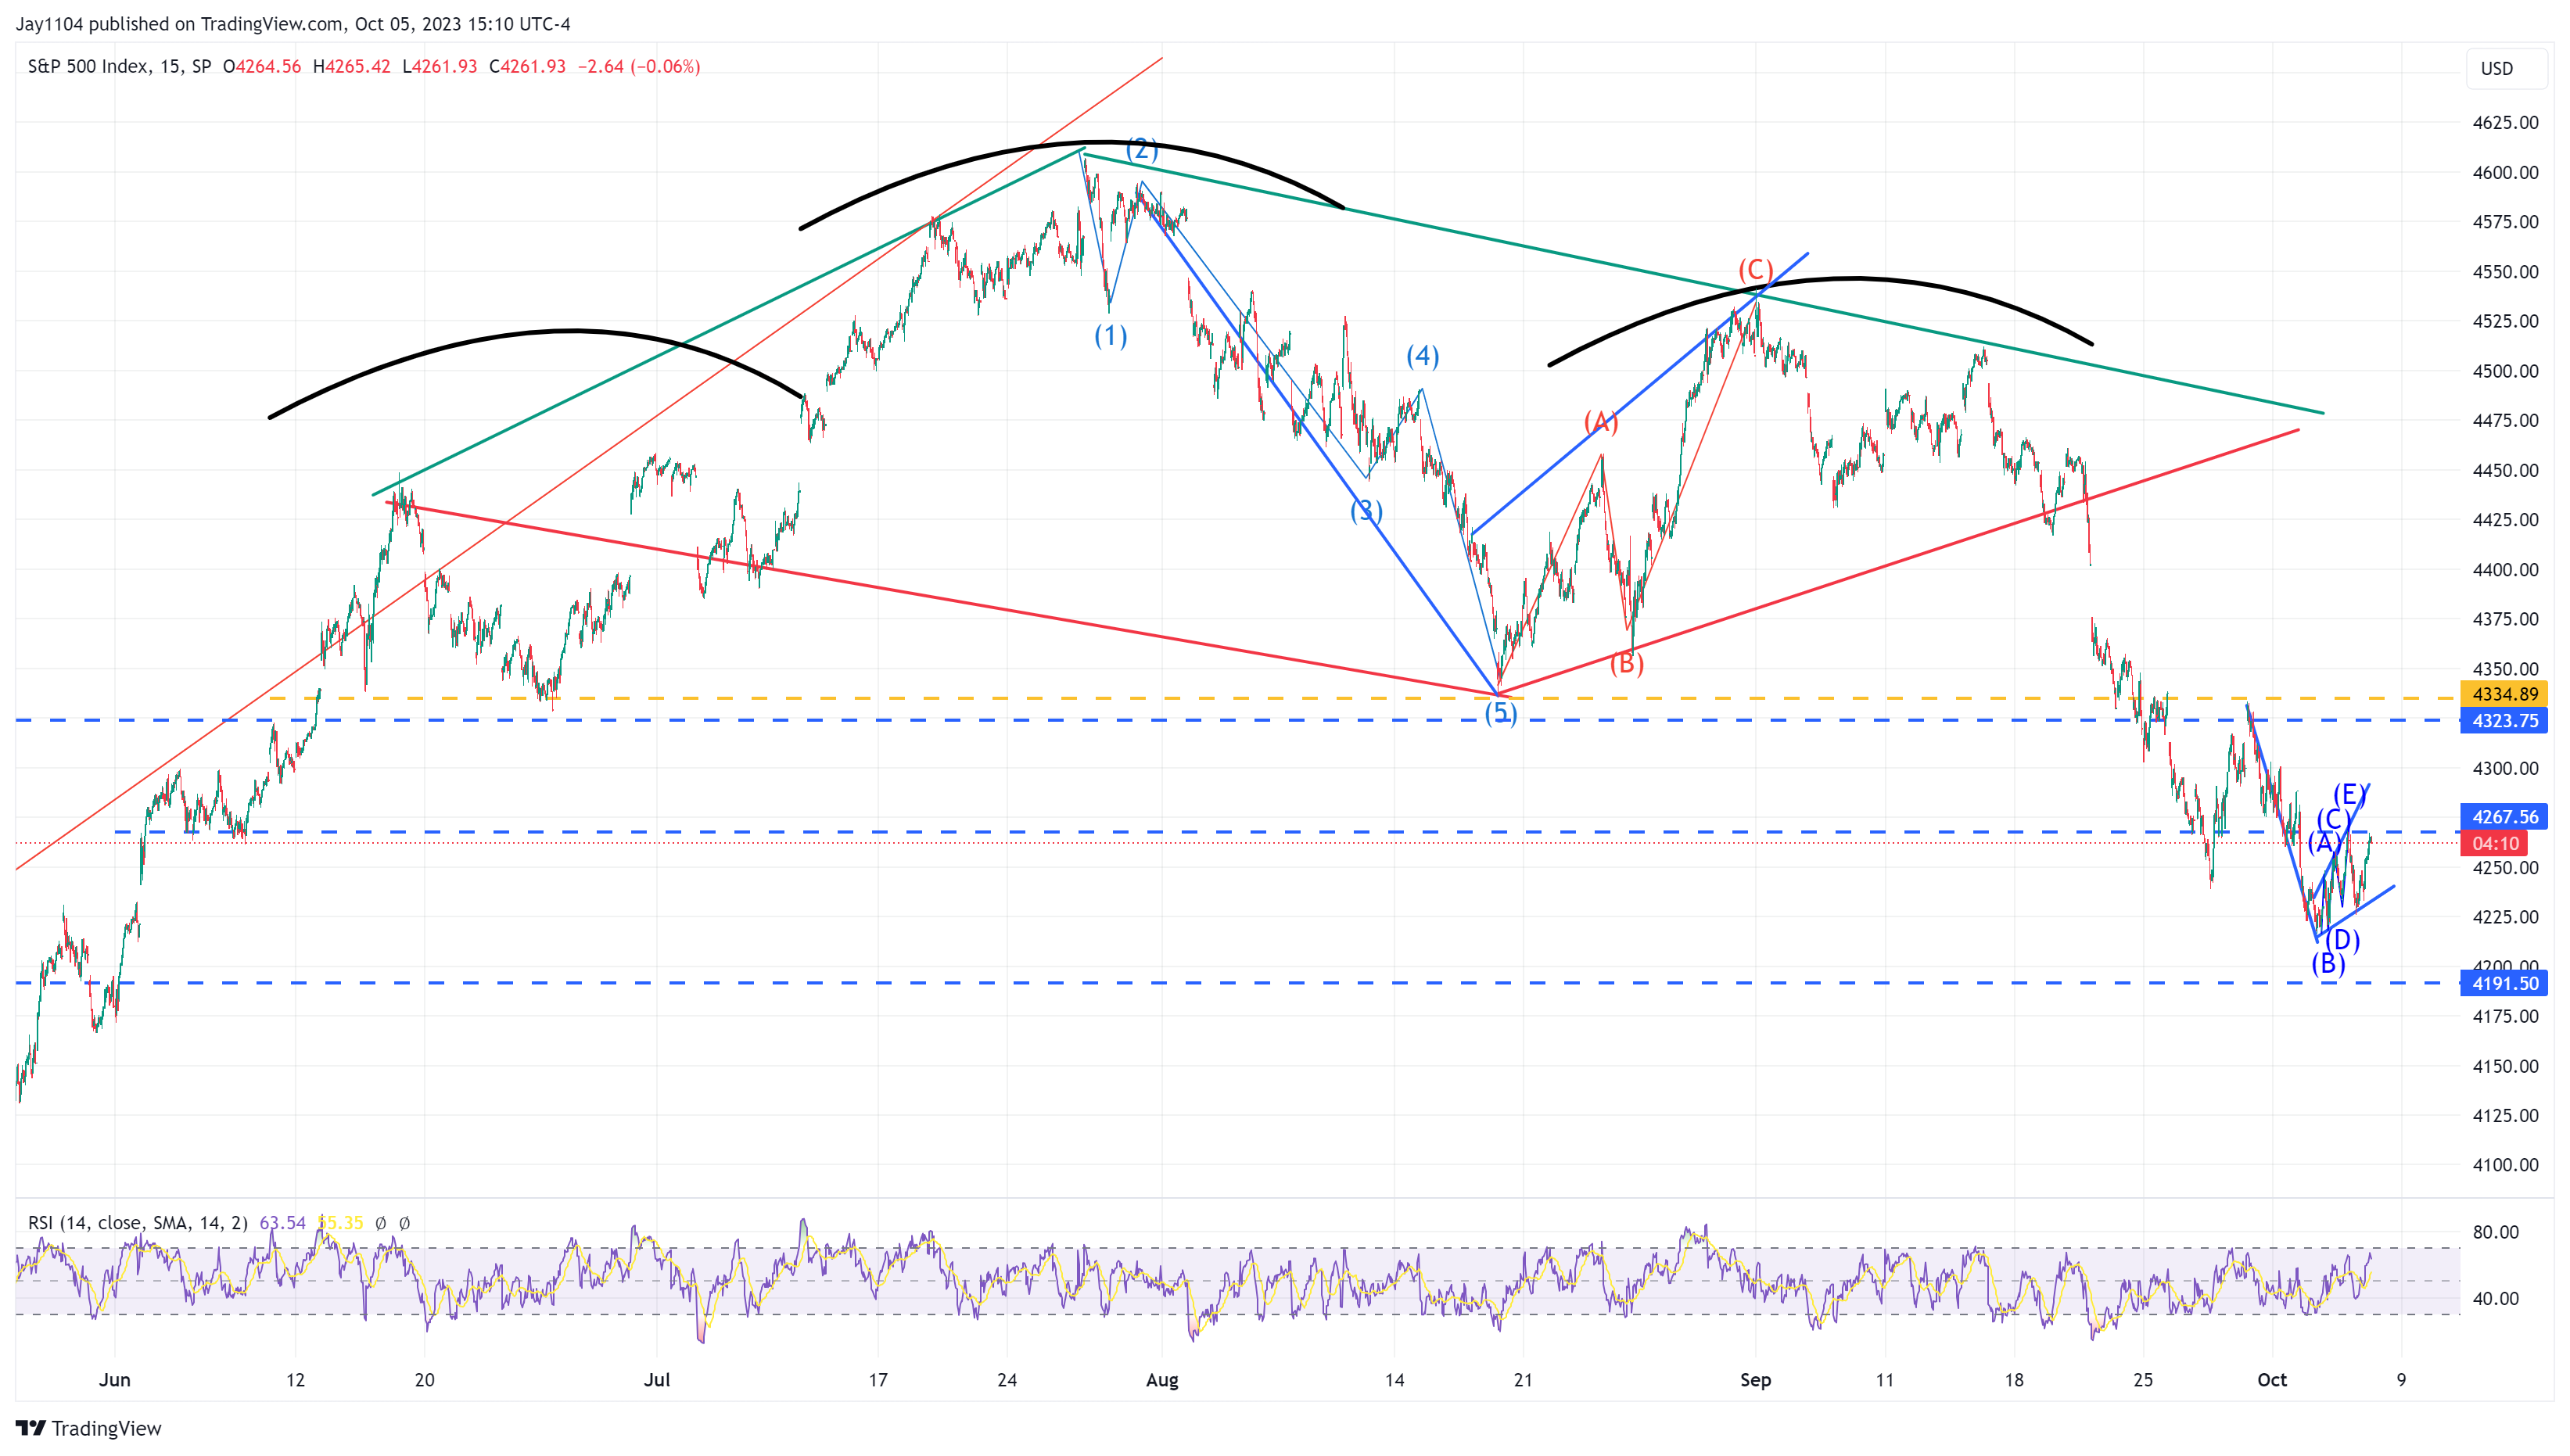 S&P 500 Index-15-Minute Chart
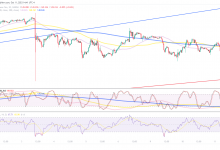
If the job report wasn’t today, then the chart below shows a broadening wedge, which resembles a bear flag, and that would suggest that the next break in the S&P 500 would be lower and towards 4,150.
But the job report isn’t likely to change much unless it is horrible or very hot. While not highly correlated to the official job report, the ADP report took some of the edge off the bond market yesterday. I don’t think we are likely to see rates on the back of the curve fall all that much from where they are currently, based on the Fed’s projections for rates into 2024 and 2025. Which means the prospects for lower equity values persist.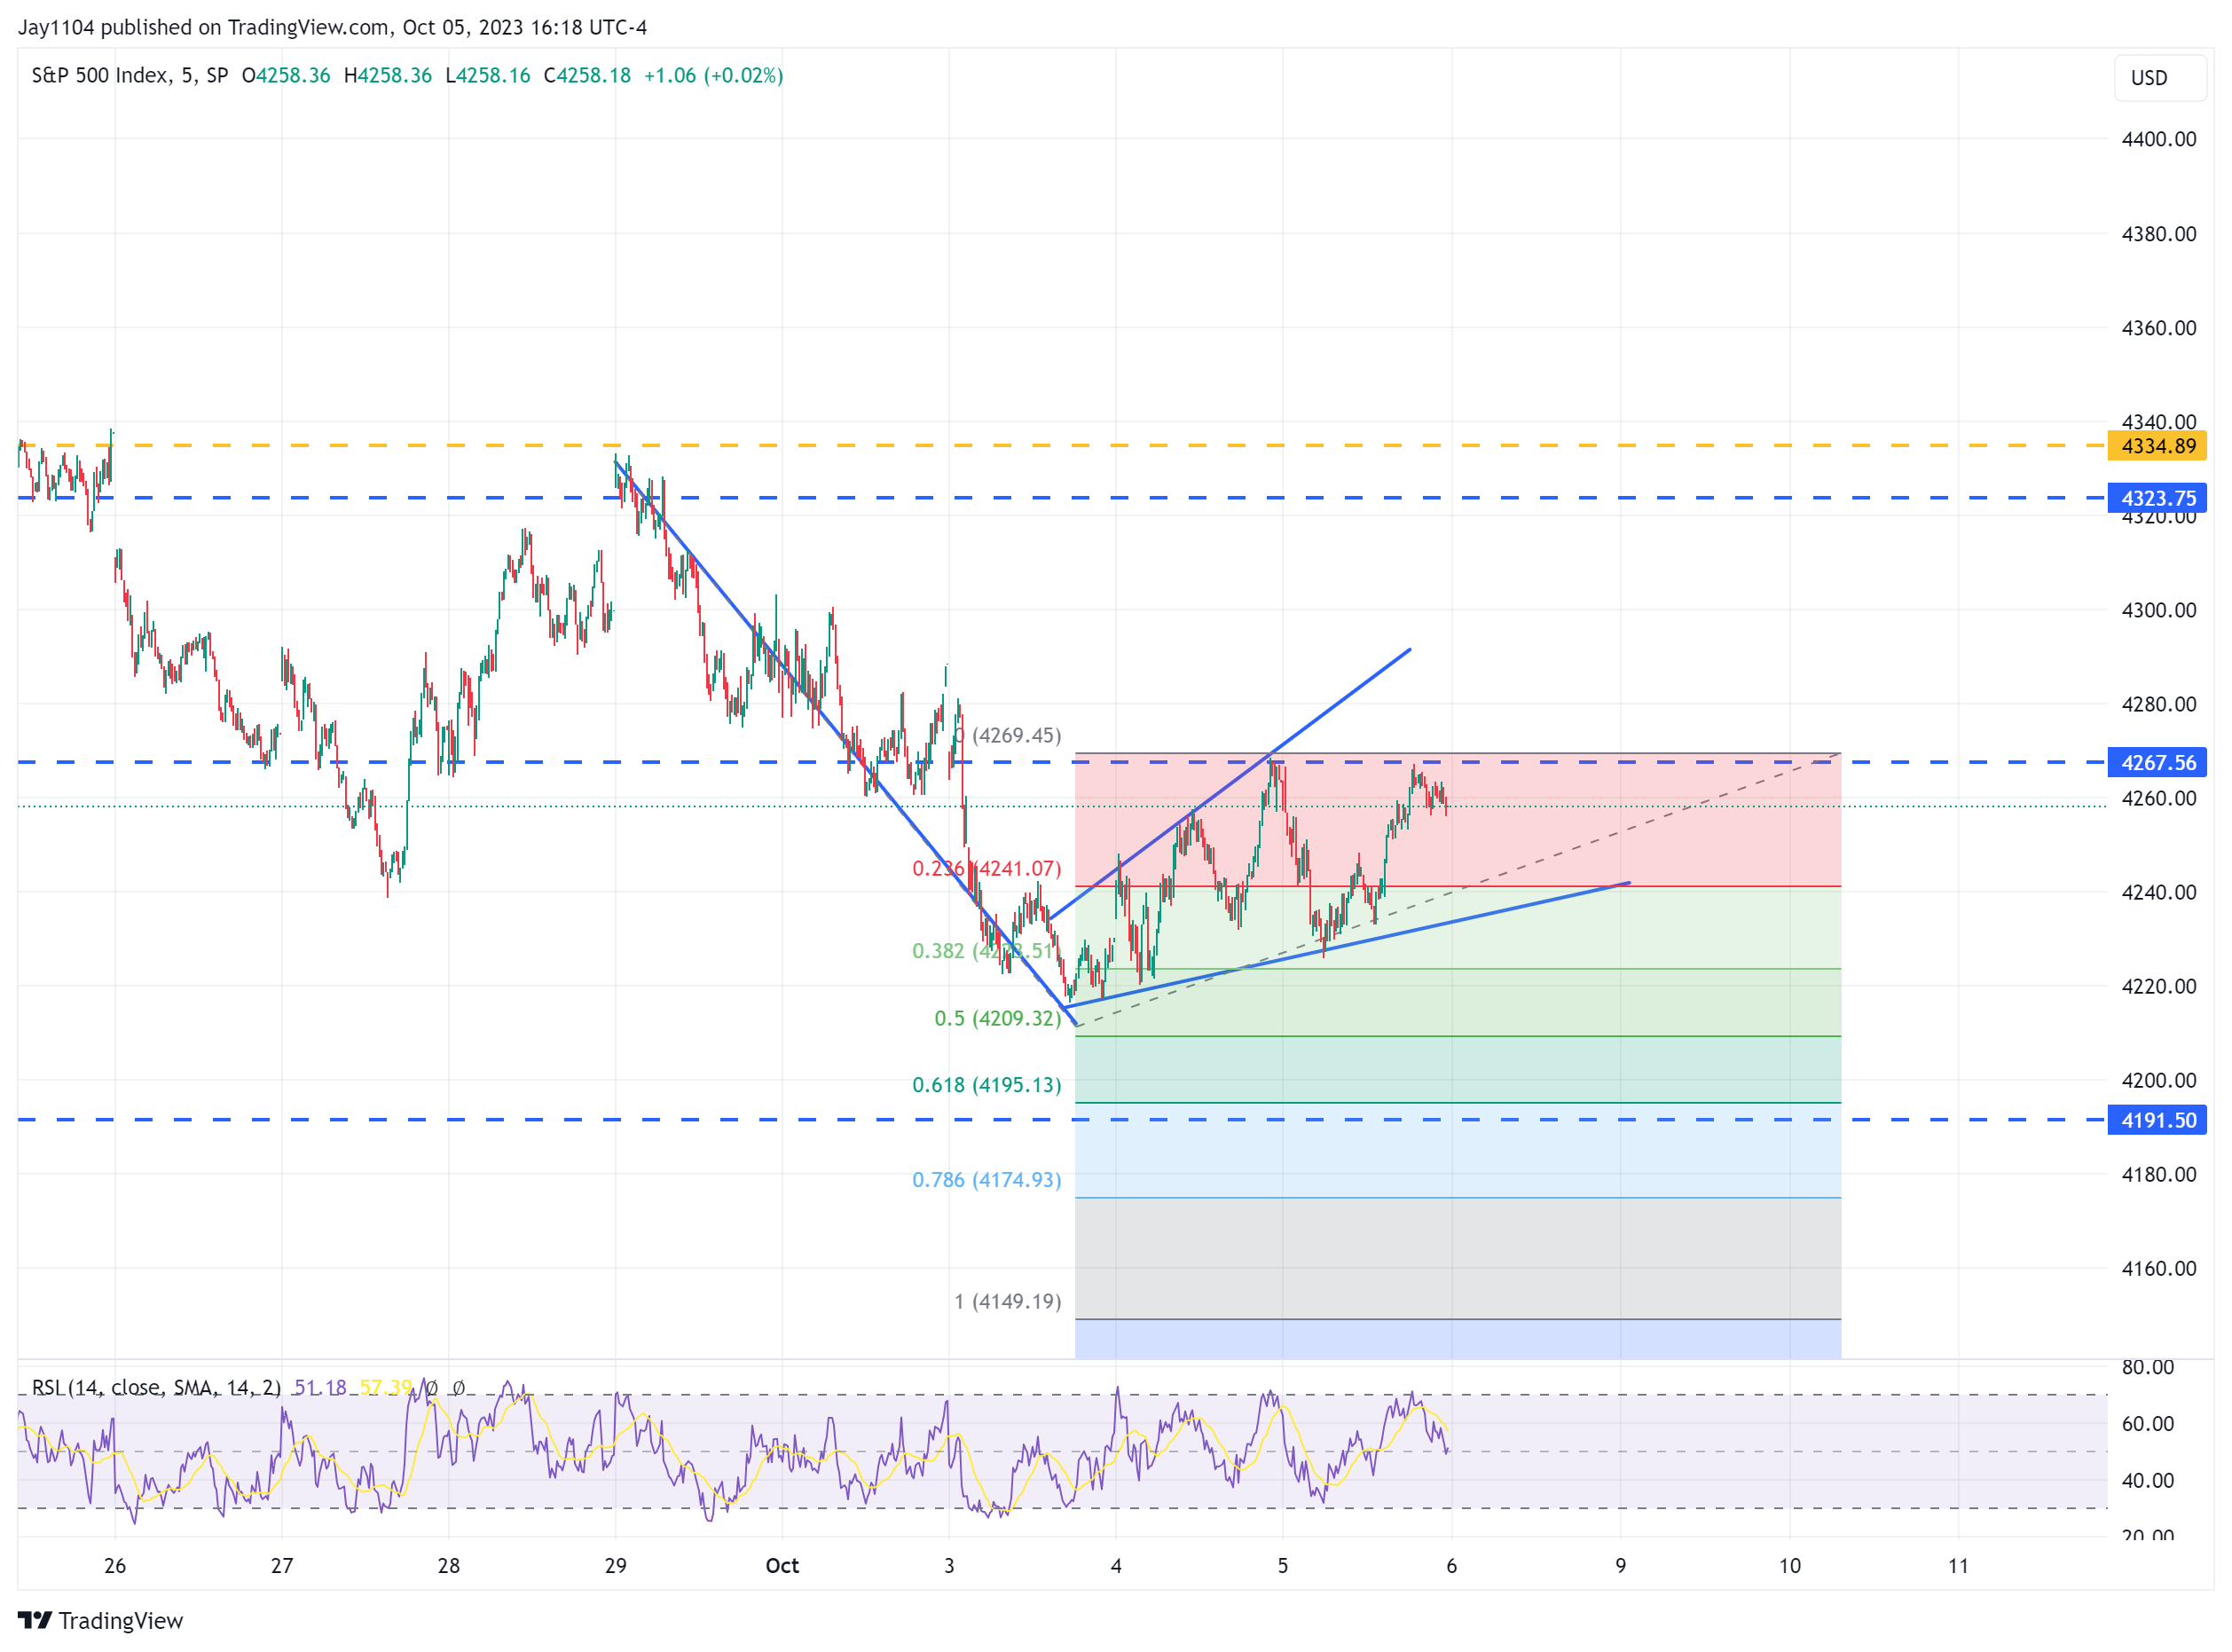 S&P 500 Index-5-Minute Chart
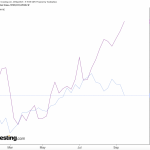
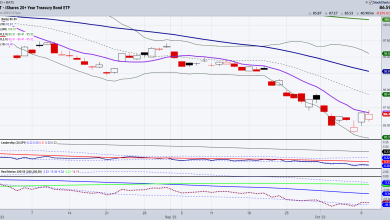
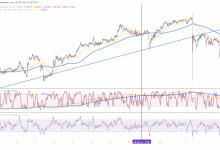
Rates have been rising mostly due to the better-than-expected economic data and finally buying into the Fed forecast. The data from the September 1 job report started this recent leg higher in the 10-year.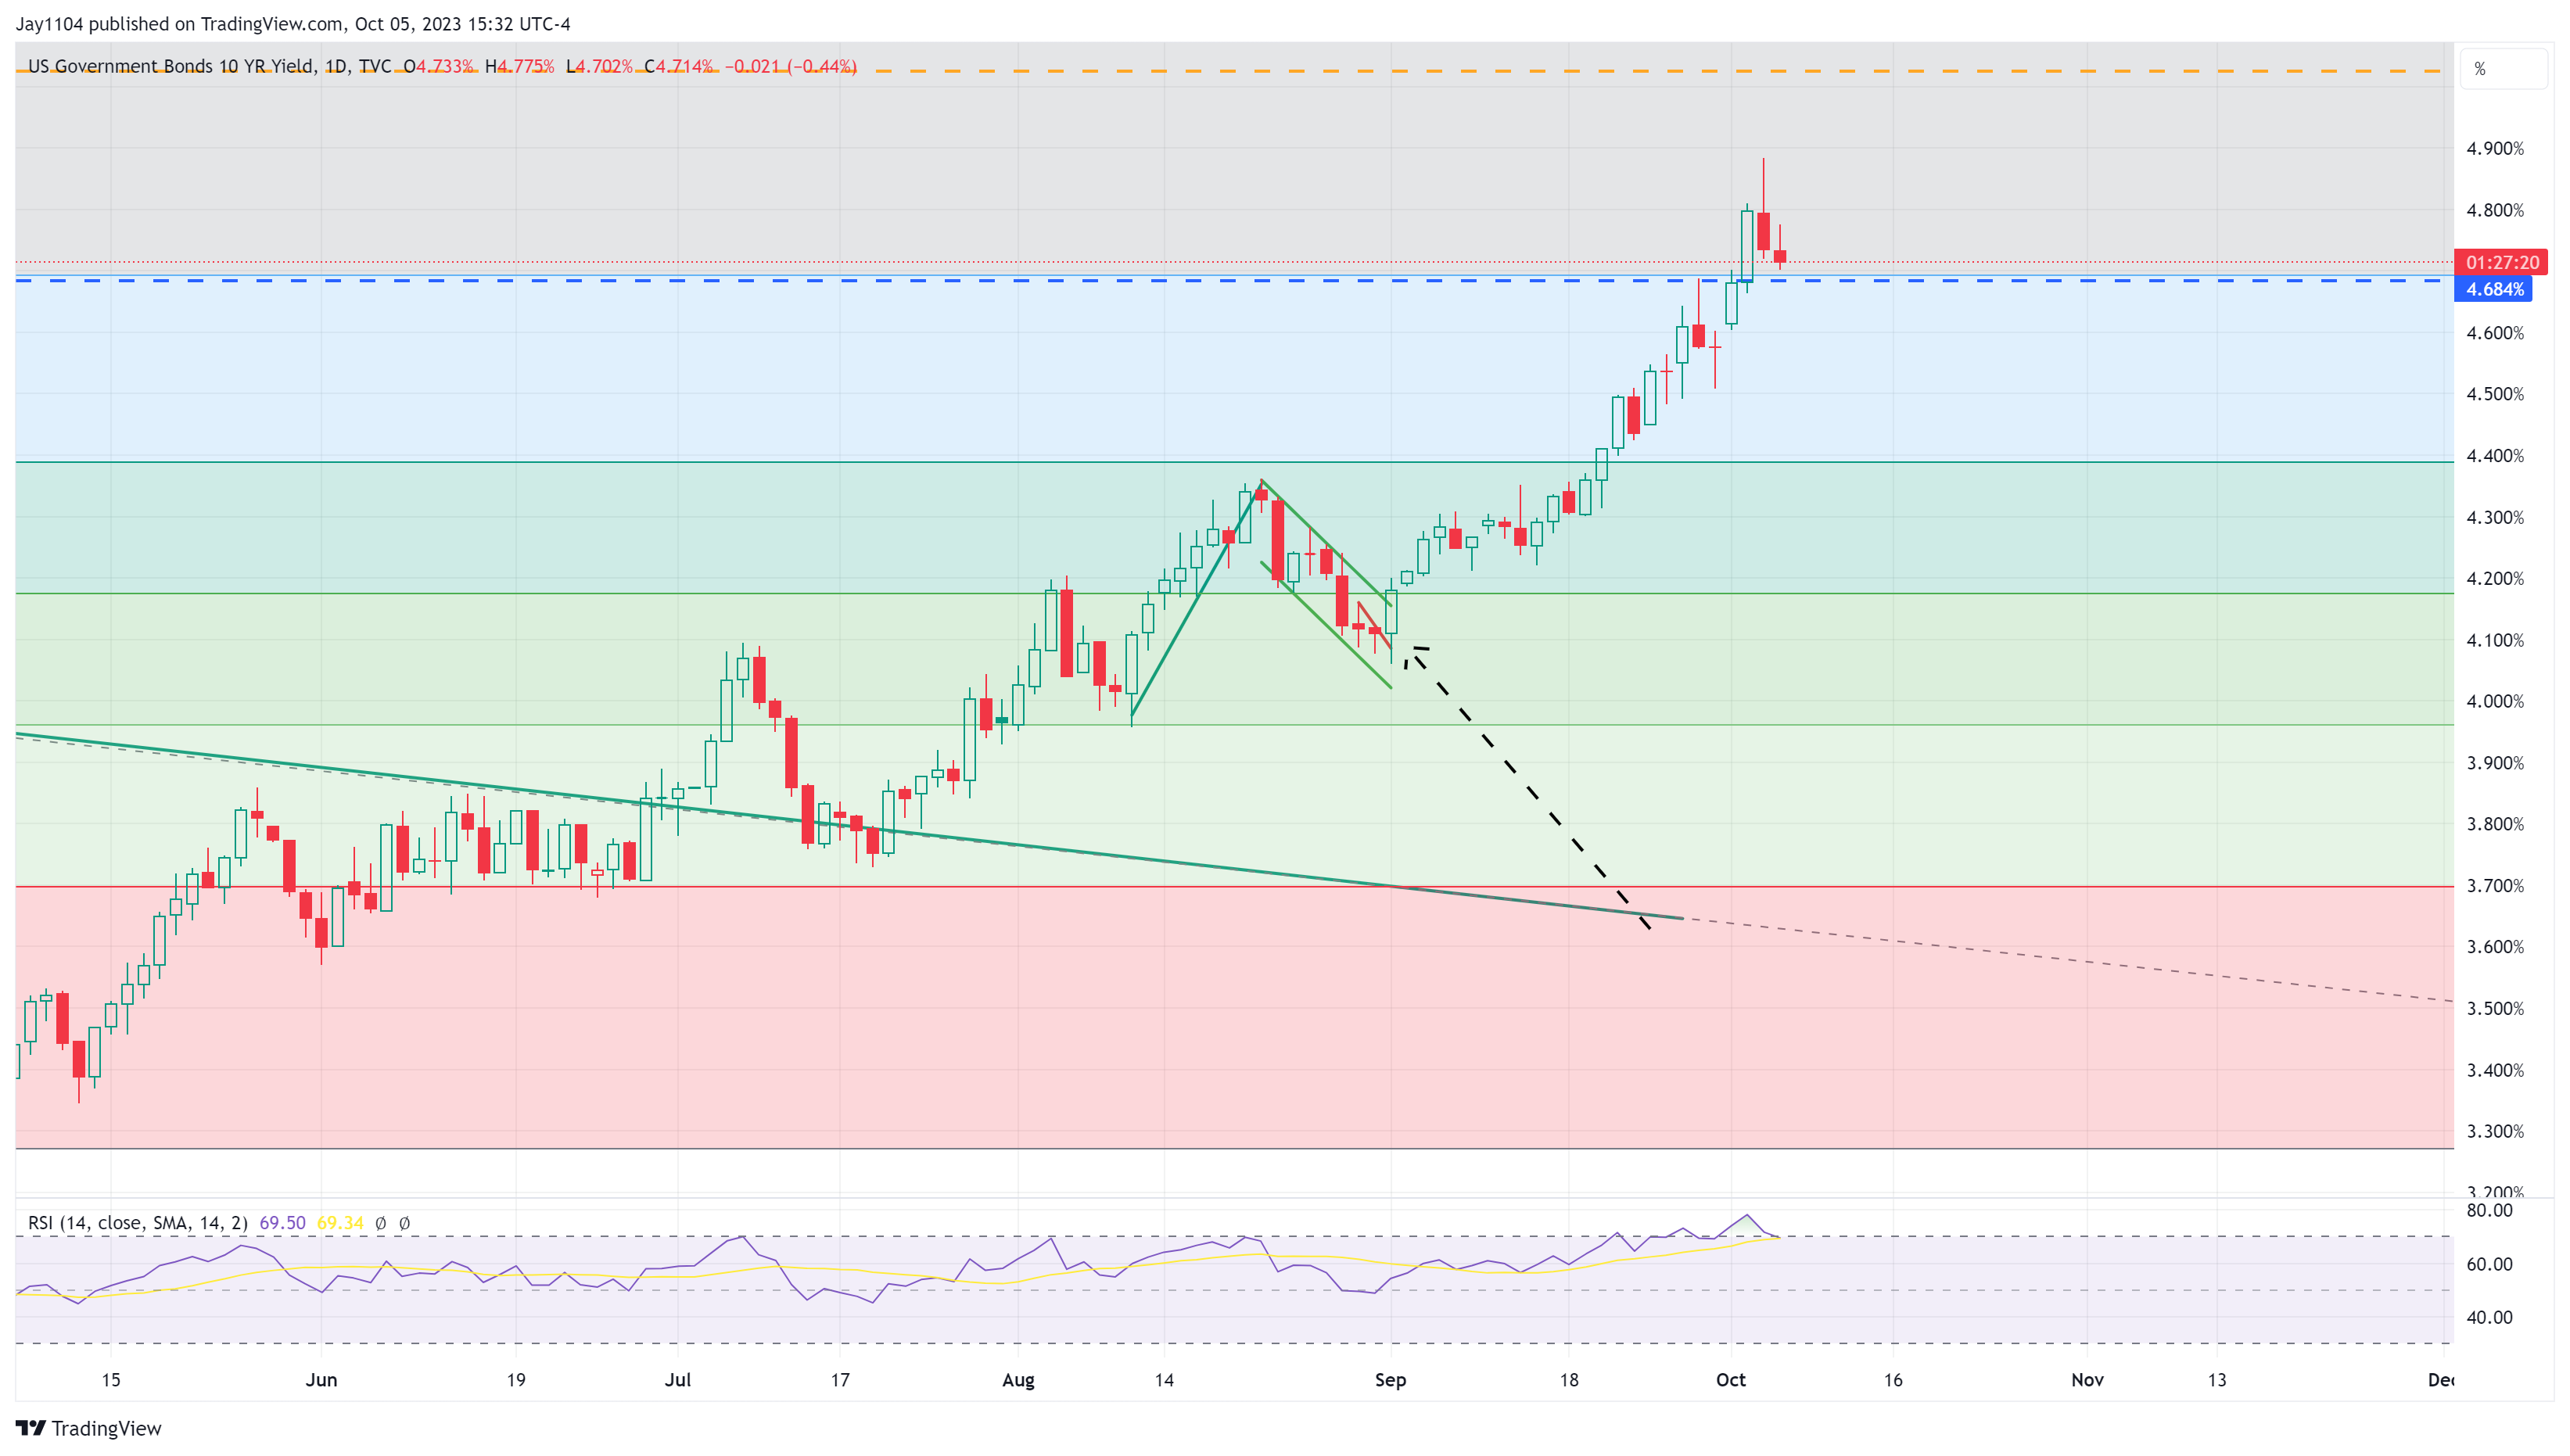 US 10-Year Yield-Daily Chart
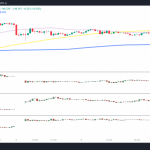
Meanwhile, the yield curve is now steepening, and it’s very clear when looking at the 3-month minus the 30-year, and typically, once it starts, it can happen pretty quickly.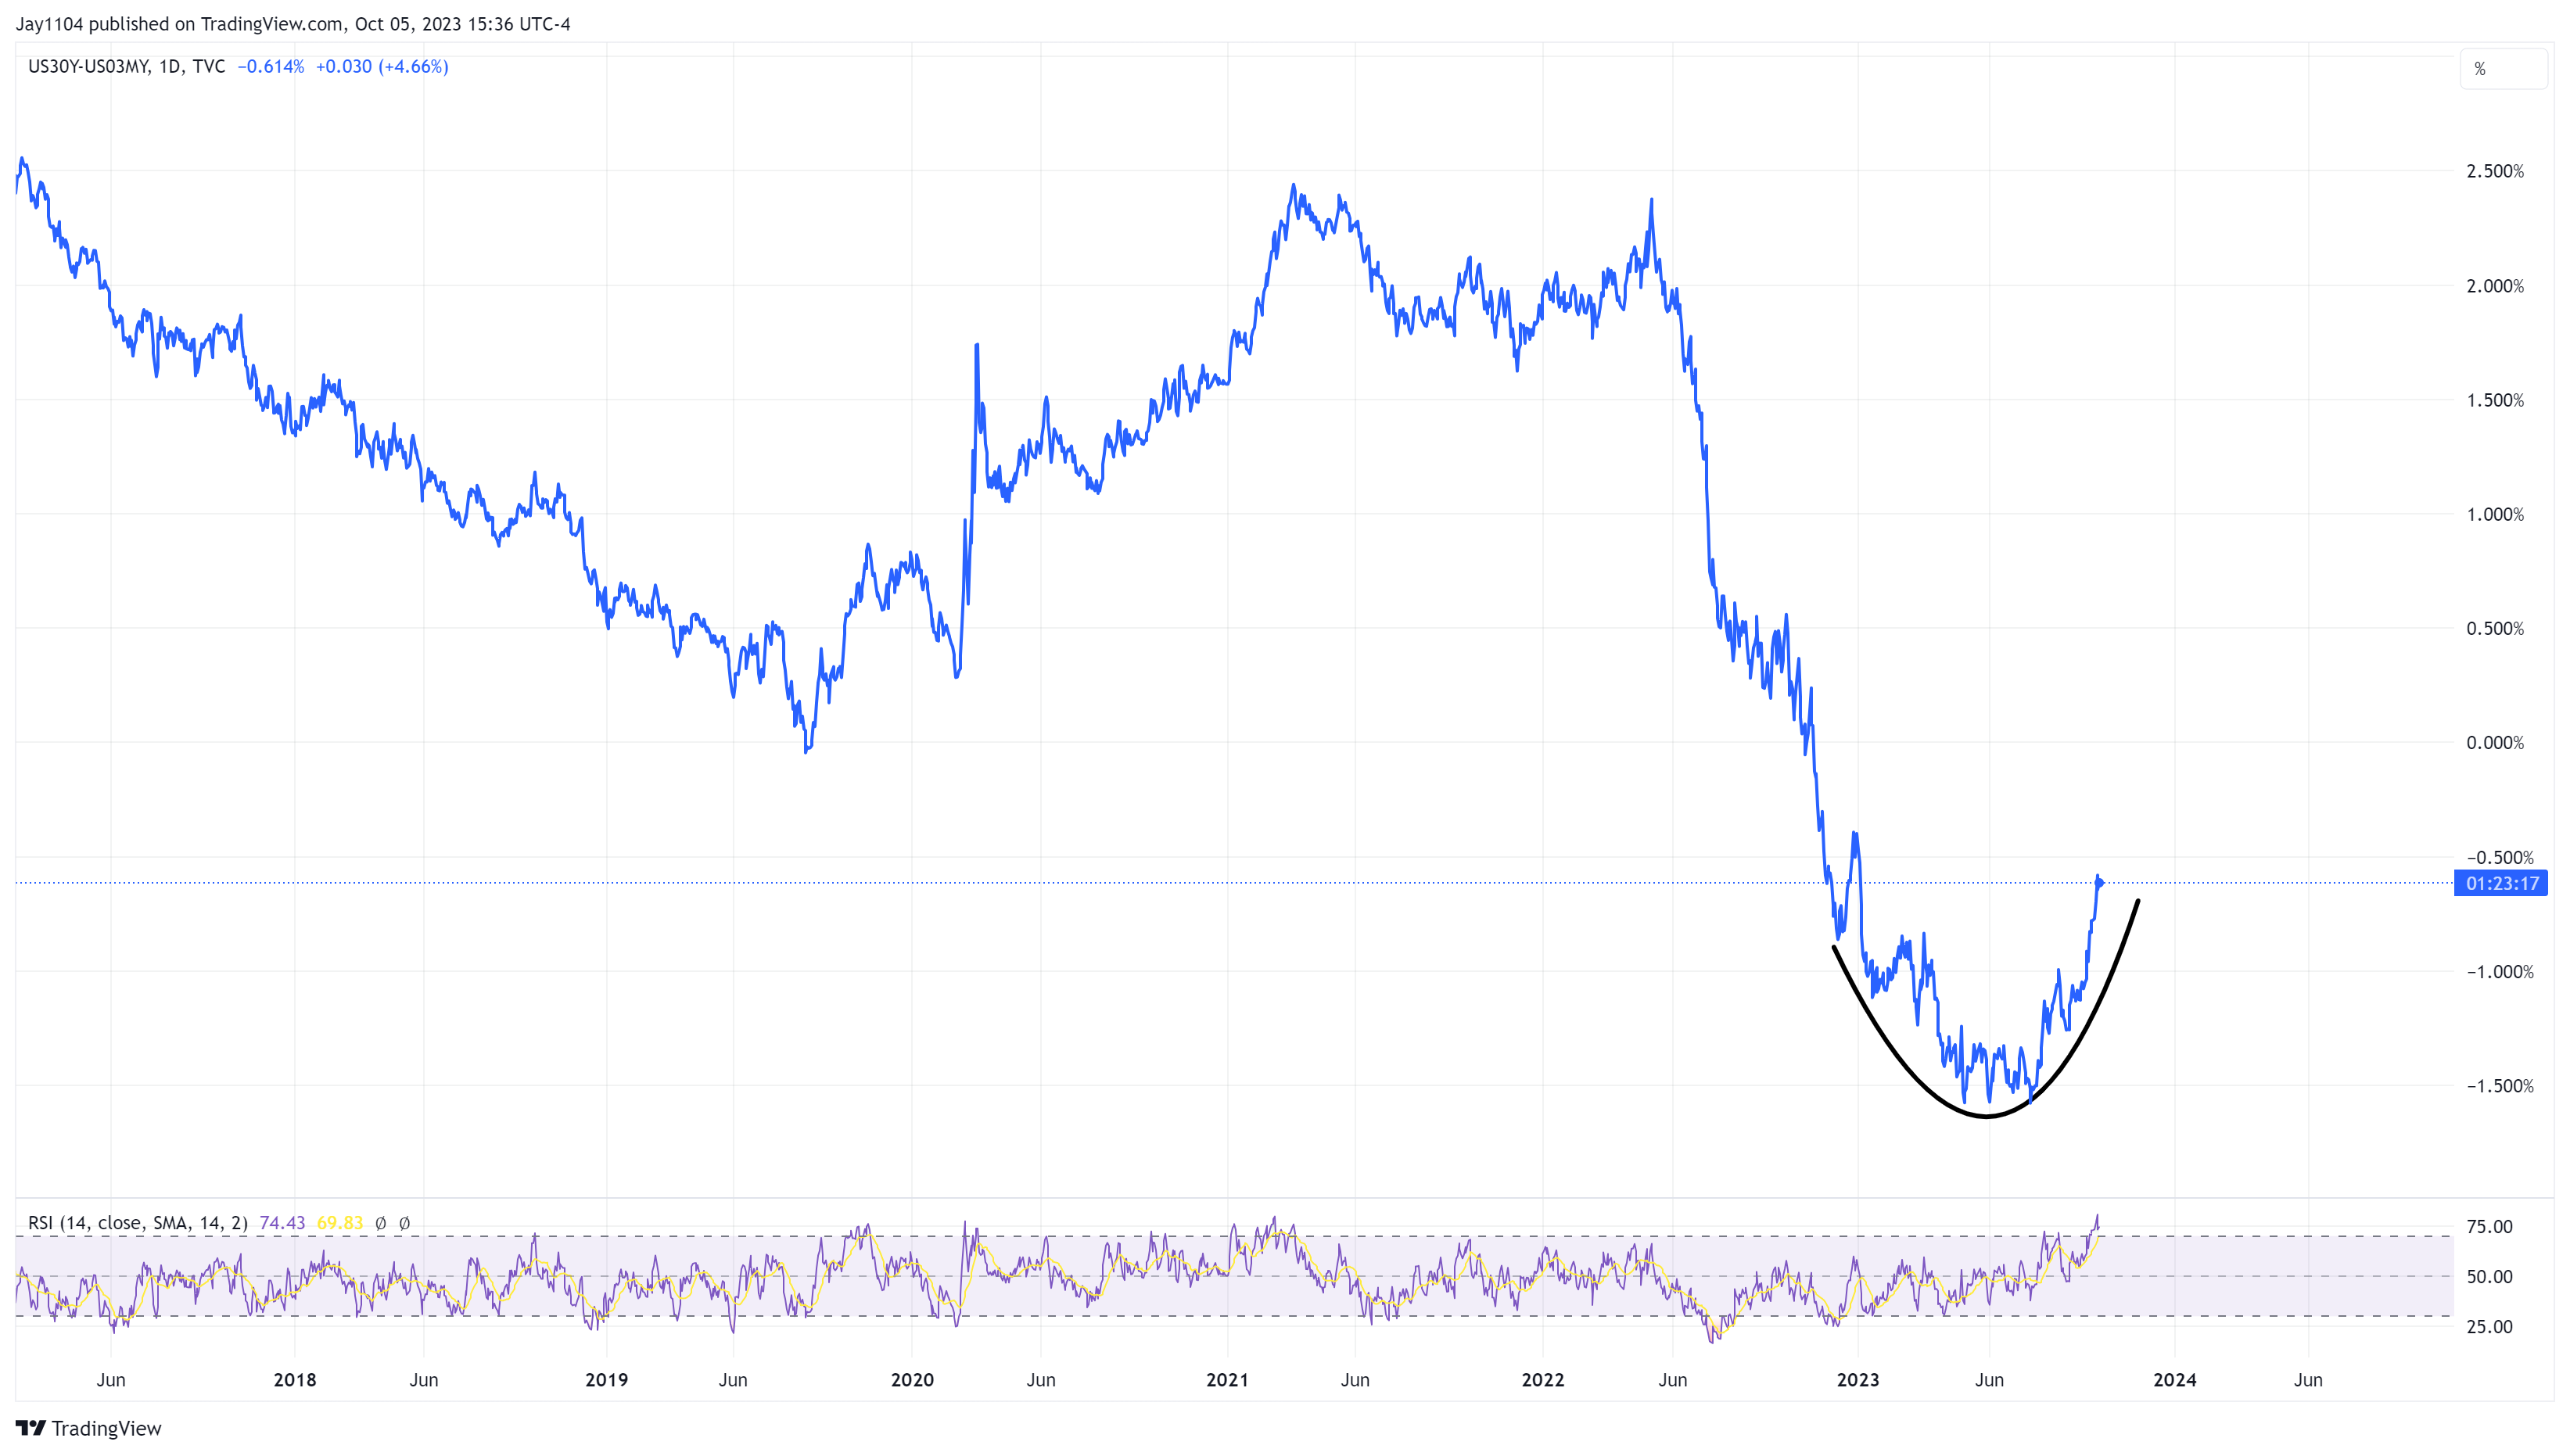 US30Y-US03MY-Daily Chart
Once that process starts, it seems to continue until completion. This part of the steepening is because the 30-year rate is rising to the 3-month, and that is because the market thinks the economy is on solid footing and the Fed forecasts. But rising rates and a steeper curve will mean that financial conditions tighten, and that will slow the economy, and that will not be good for stocks, as we know from all of last year.
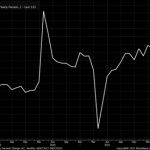
So, one would think that unless there is some major surprise to the downside tomorrow in the jobs data, the process of the yield curve steepening should continue.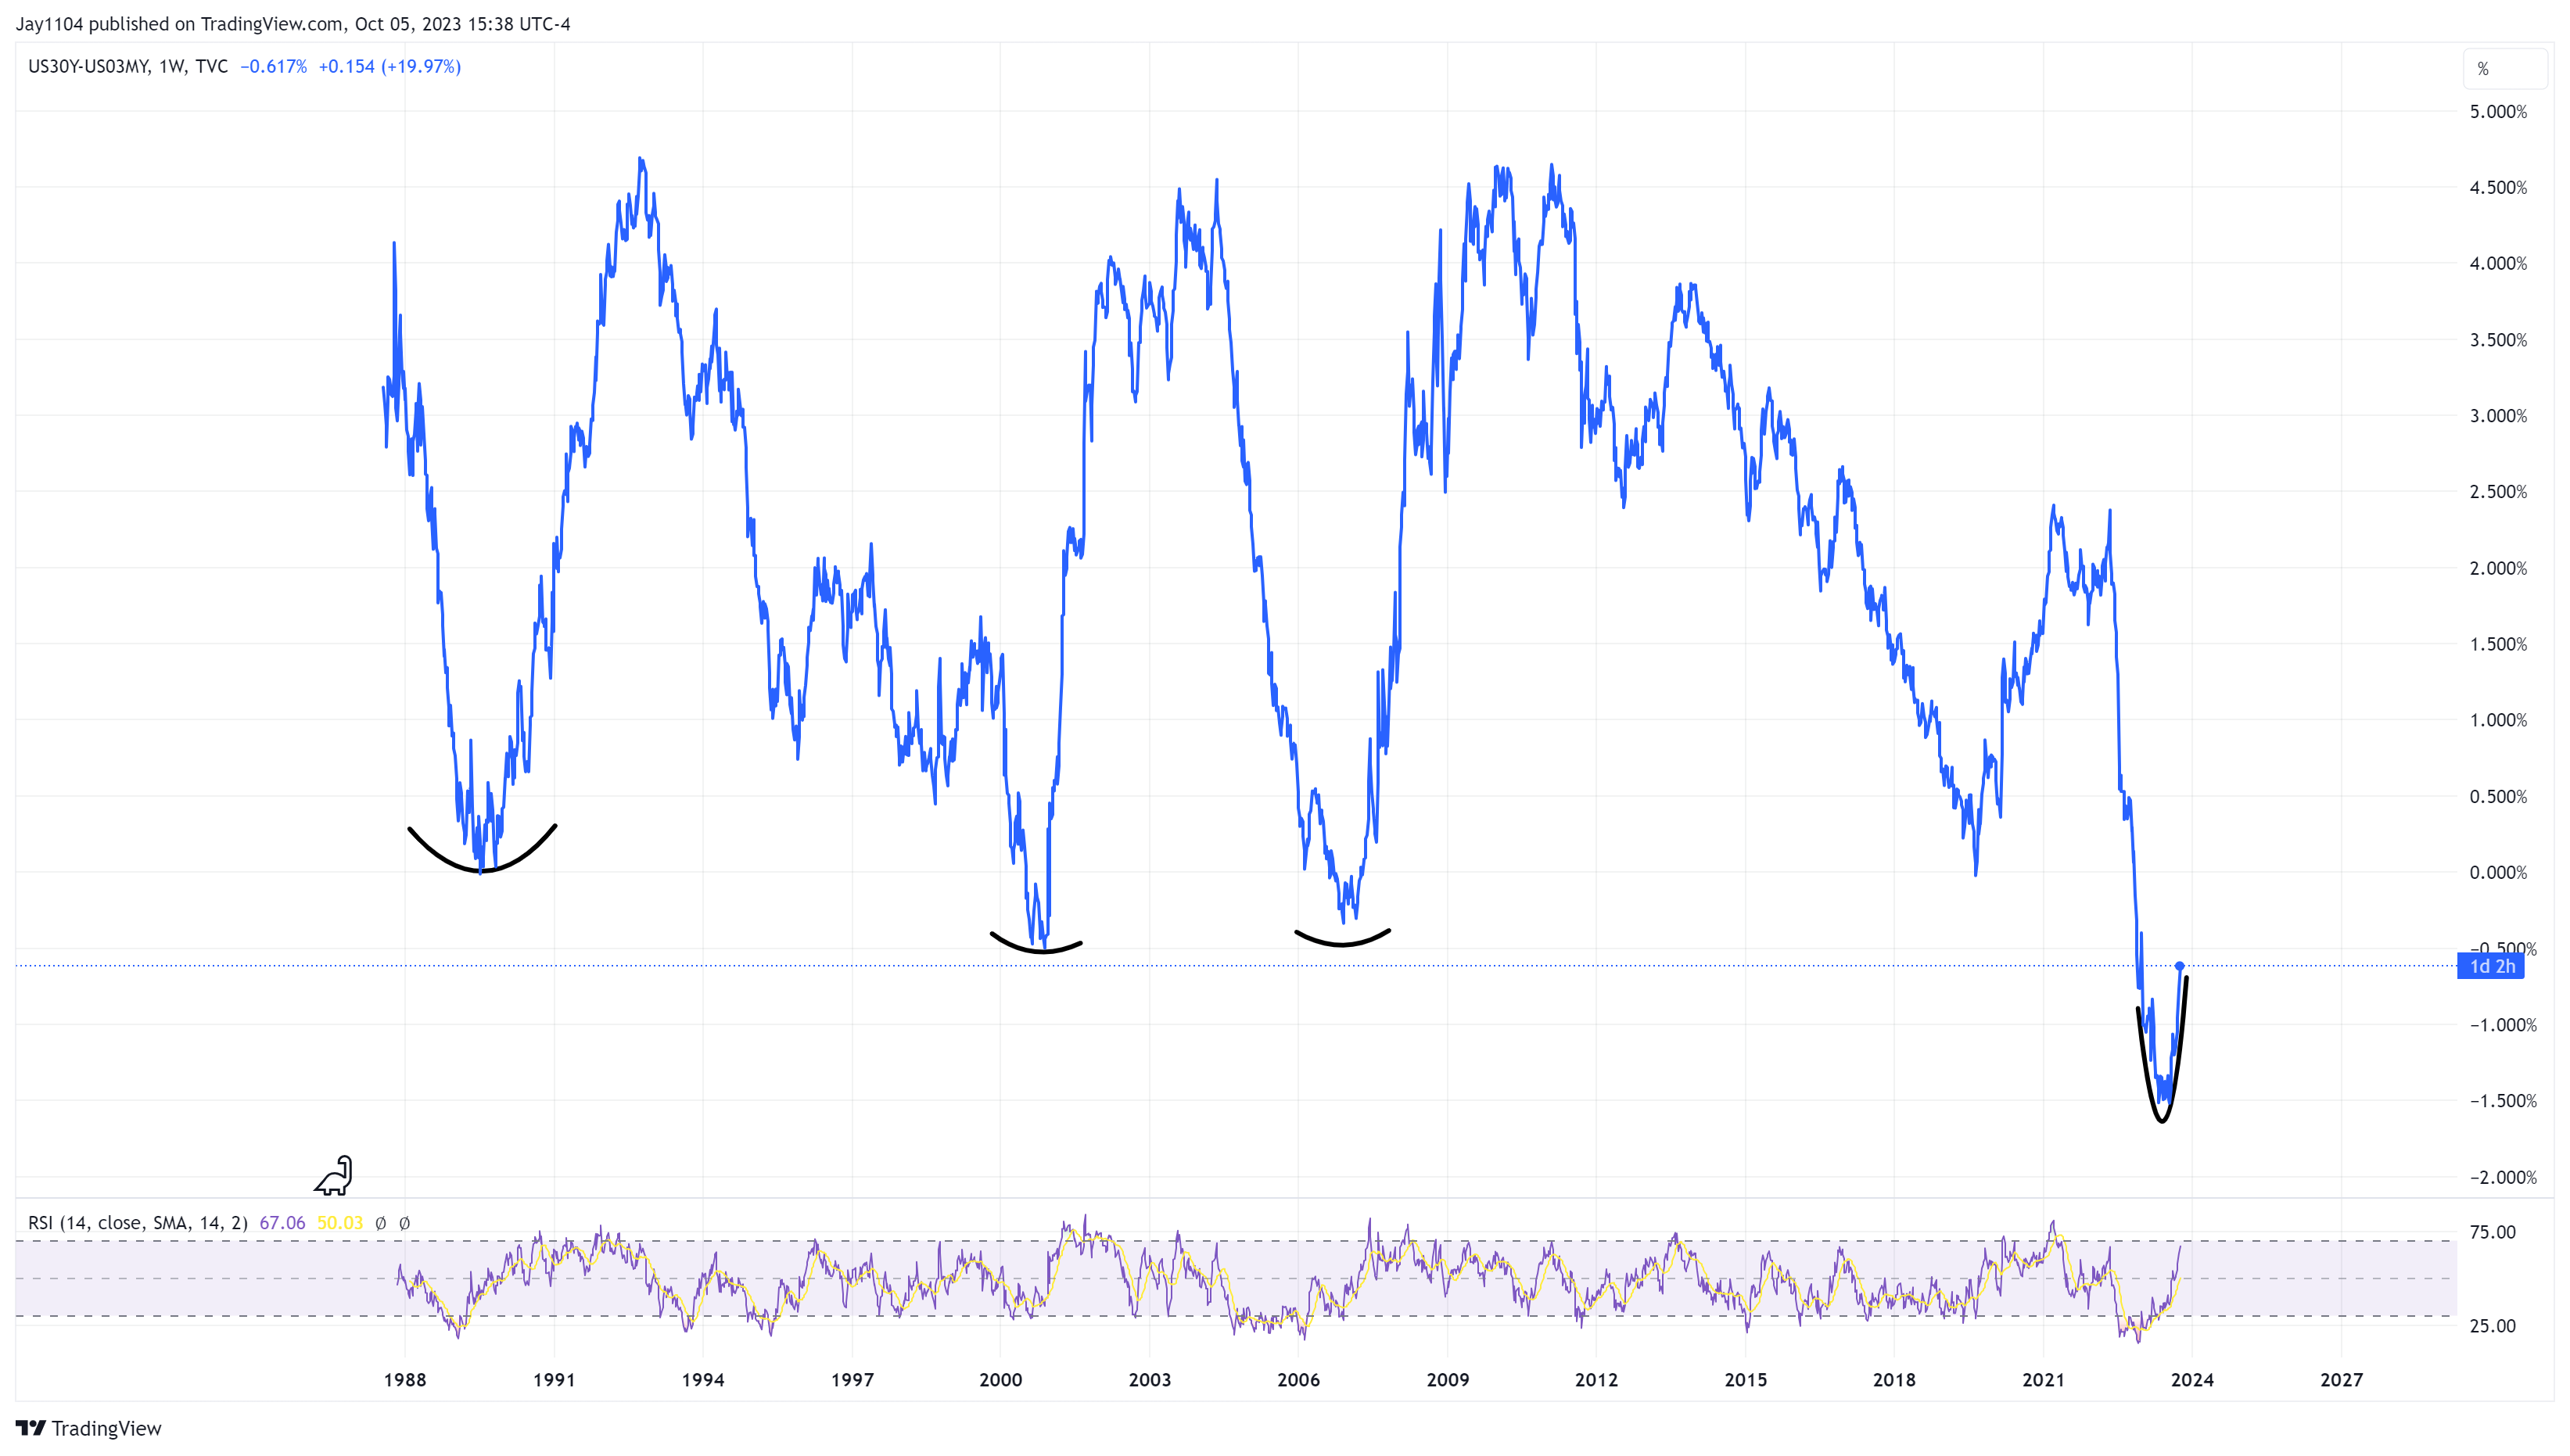 US30Y-US03MY-Weekly Chart
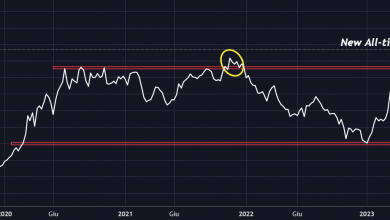
The chart of the iShares MSCI ACWI ETF (NASDAQ:ACWI) looks pretty bad. It has fallen below resistance, turned support at $93.25, and now sits just above resistance around $90.50.
That region around $93.25 was such a tough level for the ACWI to break above, and then when it fell below it in late September, it tried to rebound and failed again. Just not a positive development. At this point, it doesn’t seem like much is stopping it from falling back to $85.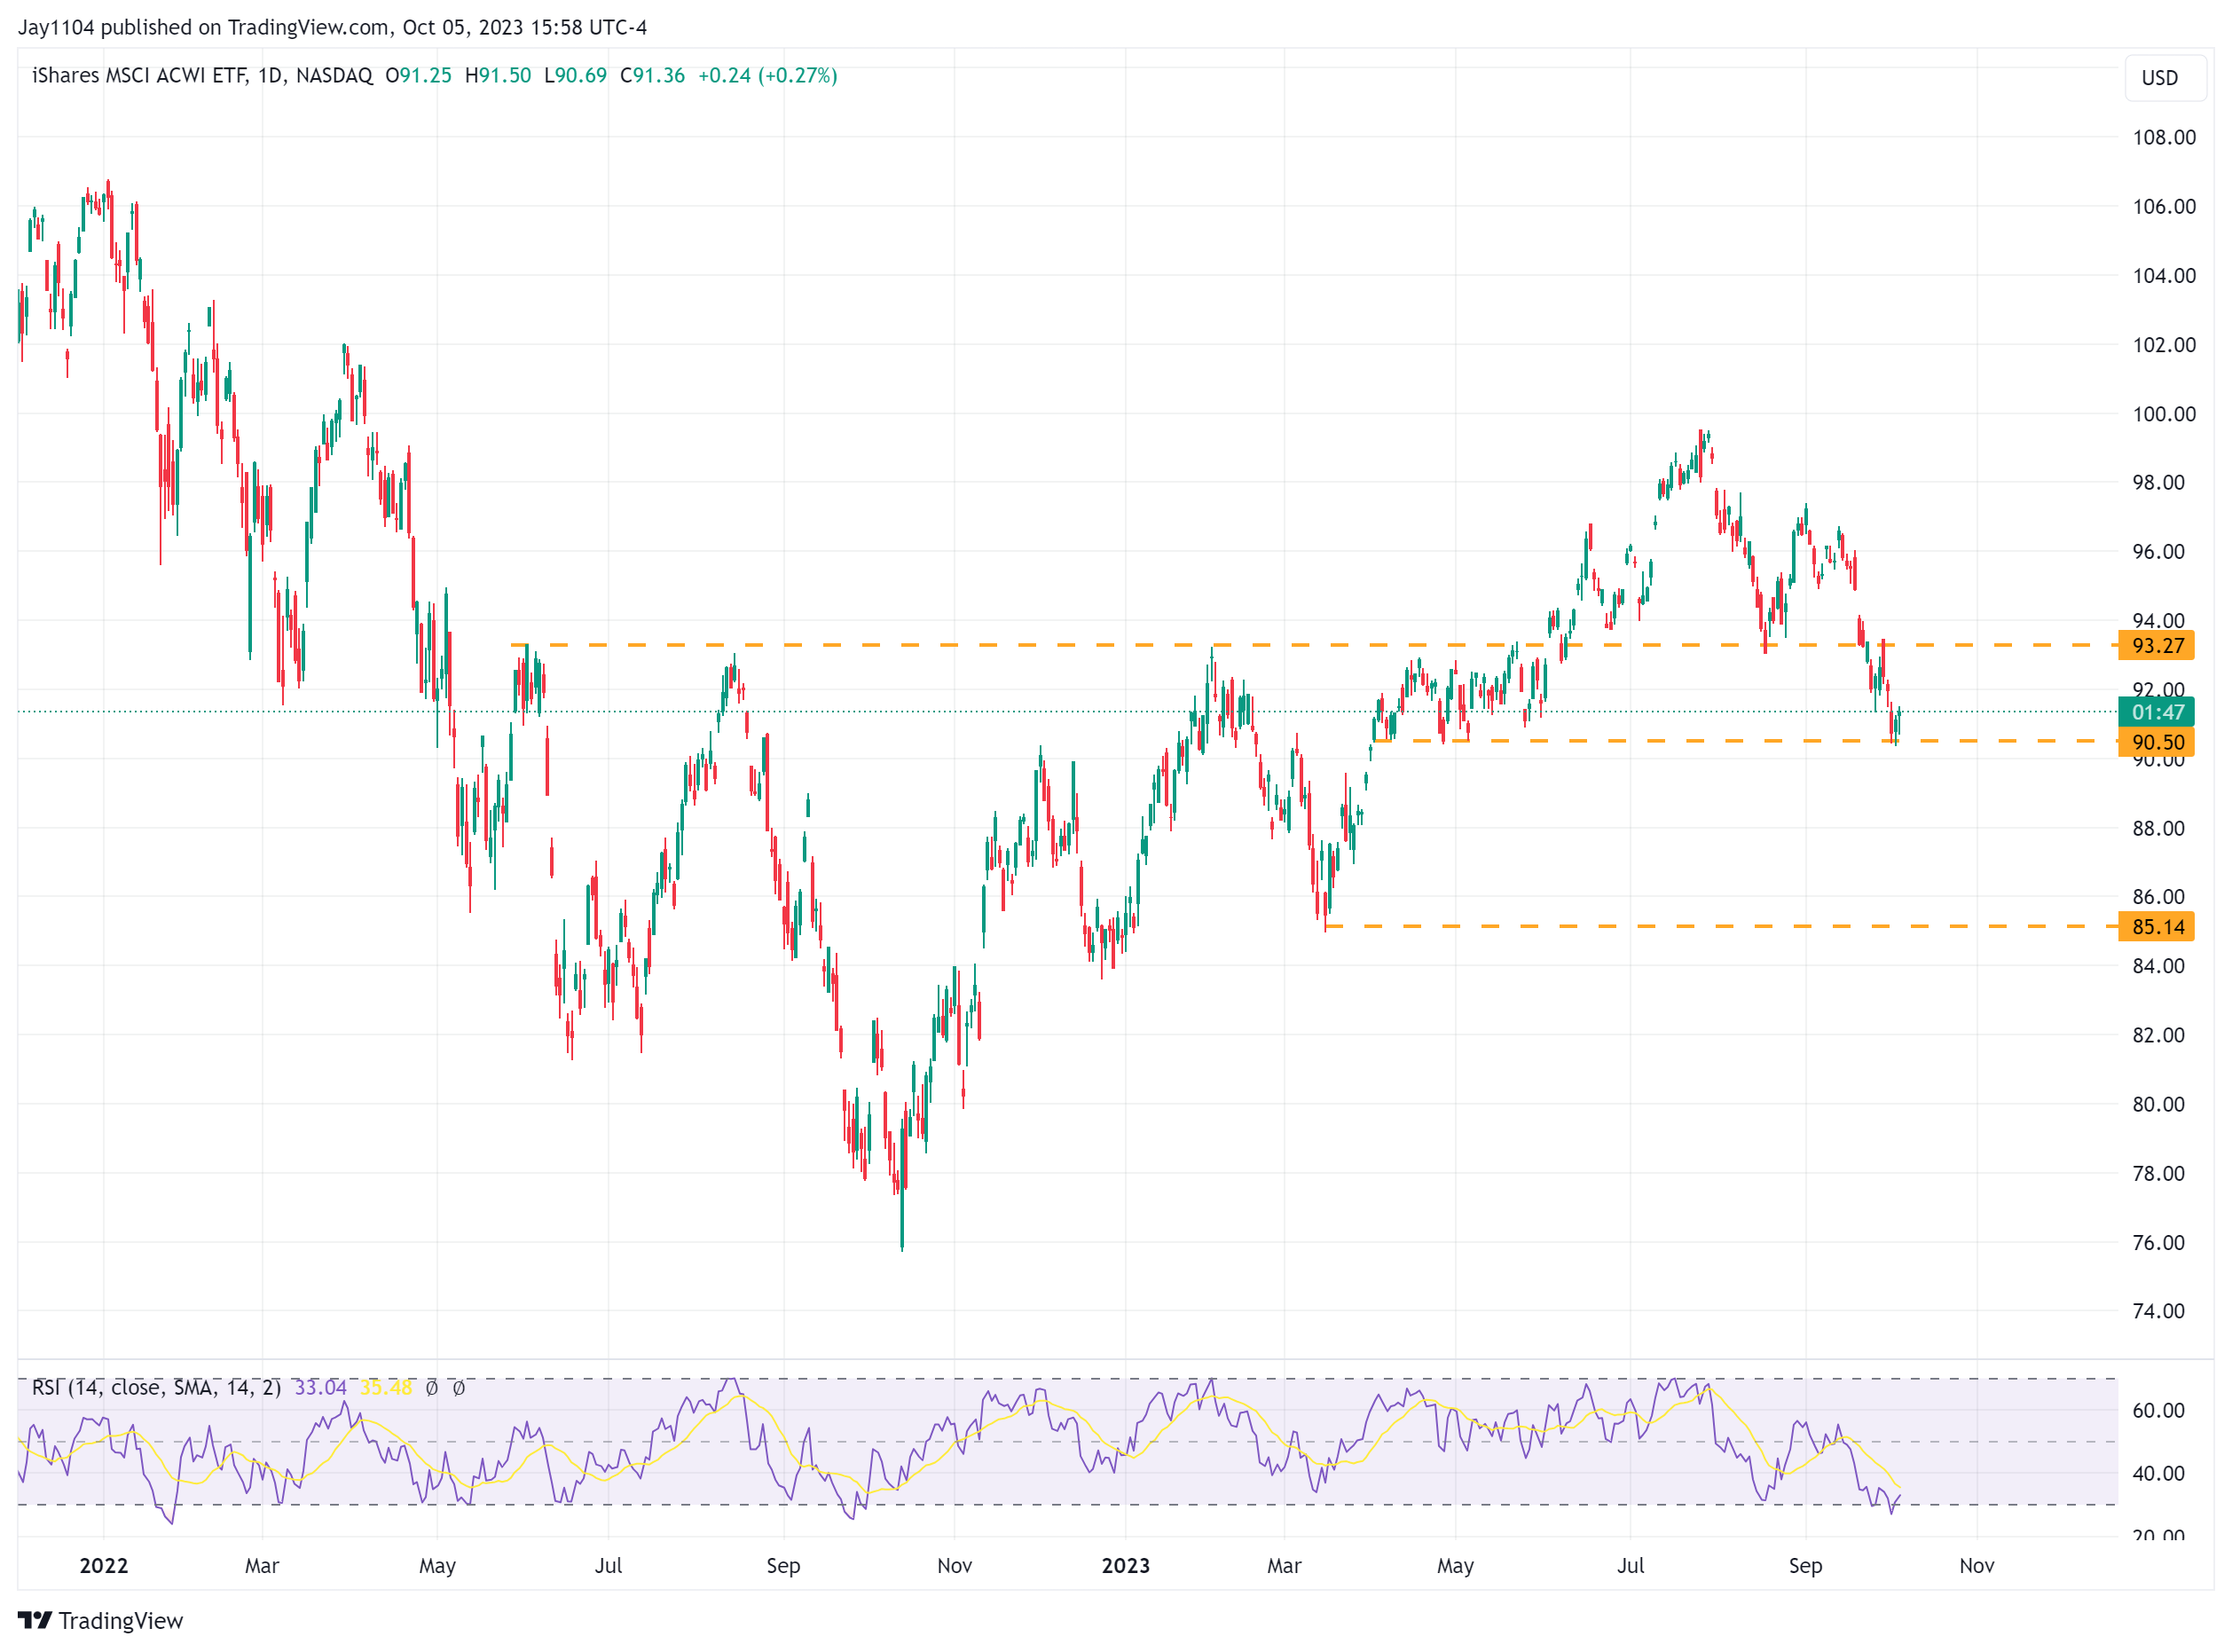 ACWI-Daily Chart
Nvidia’s (NASDAQ:NVDA) days may be numbered as the stock consolidates, forming a bearish divergence on the RSI. The technical pattern on the price being formed appears to be an incomplete reversal pattern. Unfortunately, we must wait to see when and if that next shoulder forms. It means Nvidia could still go a bit higher first. It doesn’t have to; it could easily drop from here, but if it should go higher first, a gap fill at $469 seems like a place to stop.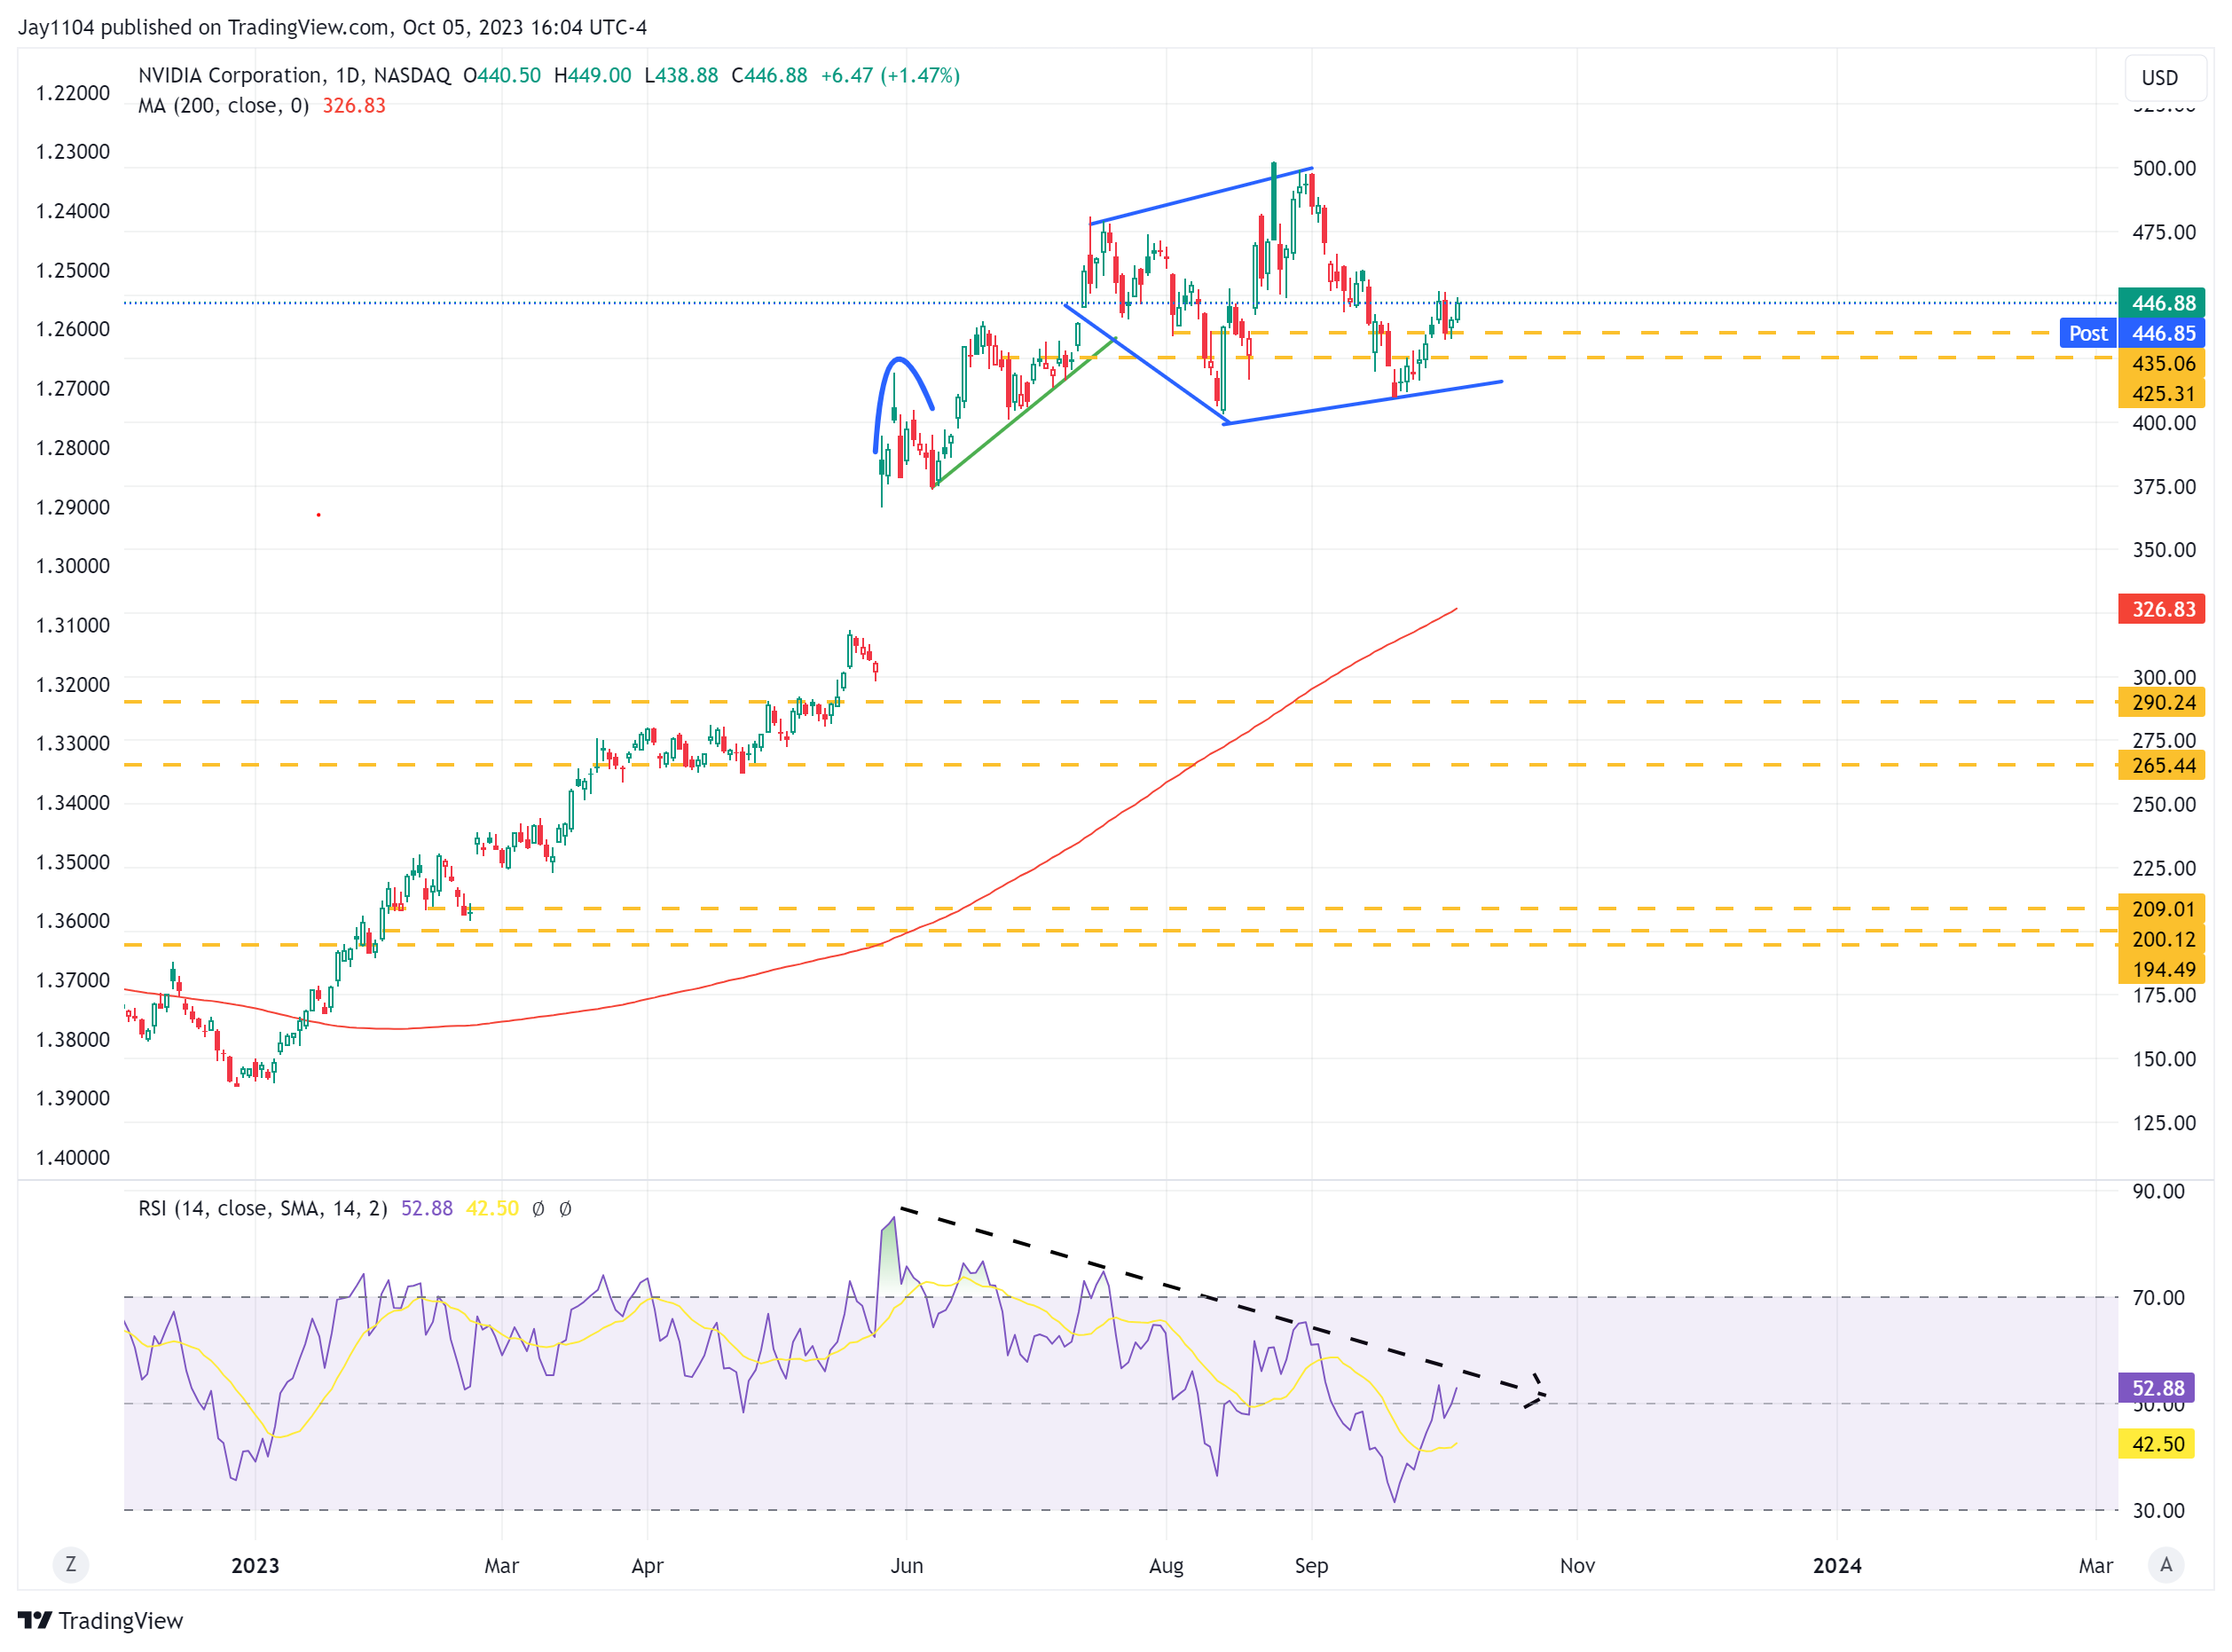 NVDA-Daily Chart