GBP/USD: Could Today’s Economic Data Finally Provide the Breakout Traders Expect?
- GBP/USD pair has finally bounced after a sustained downtrend
- The pair is now coming across a resistance zone
- Could it break above the resistance zone amid Fed’s hawkish stance and a divided BOE Monetary Policy Committee?
In recent days, the Federal Reserve’s messages have been anything but consistent, leaving investors in a quandary when it comes to predicting the US dollar-related currency pairs’ movements. Earlier this week, a series of dovish statements from Fed members led to a dip in the probability of interest rate hikes, giving some support to the US dollar, which has been in a correction phase.
However, this sentiment shifted yesterday when minutes revealed that a majority of board members believe that a rate hike at the next meeting is the right course of action. This stark contrast between the market’s expectations and the Fed’s stance creates a challenging landscape for traders.
Now, the focus turns to today’s US inflation data, as both scenarios — one of holding rates and one of hiking — remain in play. Meanwhile, the Bank of England has chosen to take a break from the interest rate hike cycle, but this decision was made by a slim majority, leaving all options open.
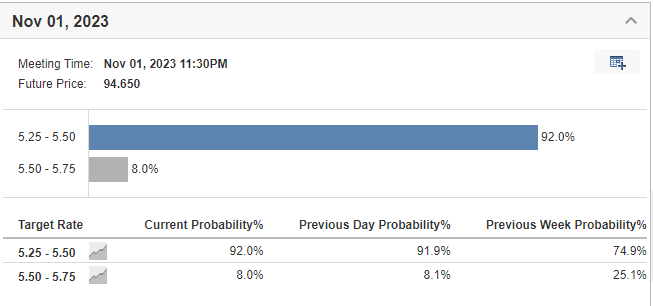
The discrepancy between the market’s assessment of the likelihood of an interest rate hike at the upcoming meeting and the statements from Fed members is evident, with a marked difference between the Fed dot plots and federal funds rate futures.Fed Rate Monitor Tool
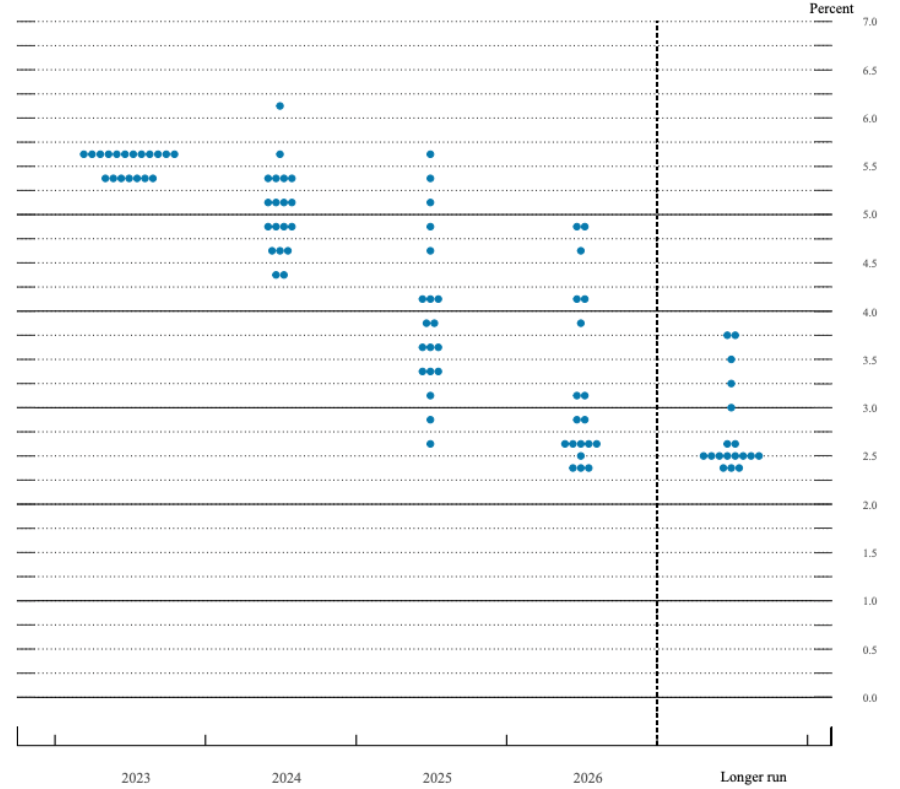 Comparison of Fed Dot Plots With Federal Funds Rate Contracts
Despite the ongoing restrictive monetary policy characterized by quantitative tightening and relatively high interest rates, there remains a notable divergence between the market and US stock indexes.
The stock market continues its upward trend without showing signs of a significant downturn. Historically, deeper declines tend to occur only after the announcement of a major policy shift, which typically precedes a period of economic recession.
In terms of the US dollar’s performance, it has shown a higher level of synchronization with market dynamics in recent months, experiencing a strengthening trend, albeit with a recent rebound in the past few days.
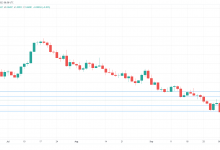
UK Disinflation Accelerates
On a different note, the UK has been grappling with accelerated disinflation, which led dovish members of the Bank of England to leverage this trend. They managed to secure a 5-to-4 majority, at least temporarily halting the ongoing interest rate hike cycle.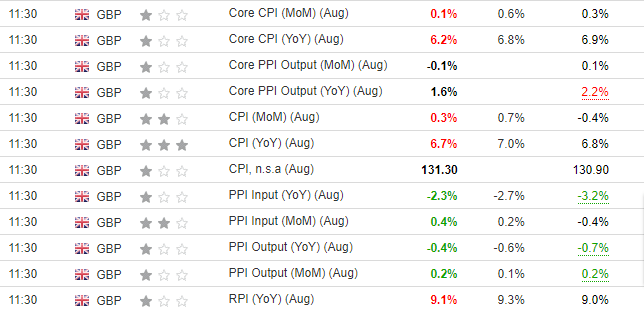 UK CPI
On a positive note, core inflation fell by as much as 0.6 percentage points from forecasts, the biggest positive surprise in recent quarters. Despite this, there is still a long way to go to reach the inflation target.
Furthermore, there are plans to reduce Treasury bond holdings by £100 billion to a total of £658 billion for the next year. As a result, the potential scenarios ahead will be greatly influenced by incoming data.
Keep an eye out for upcoming inflation readings from the UK economy on October 18, as they will play a crucial role in shaping the path forward.
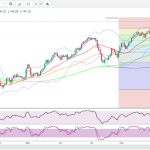
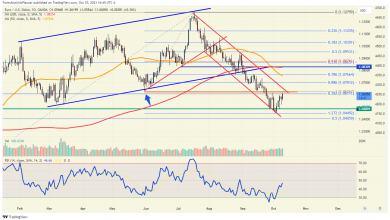
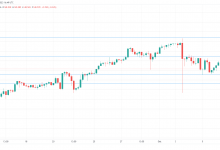
GBP/USD: Technical View
The GBP/USD pair is moving within the framework of a downtrend rebound, which is testing the first major resistance level falling in the price area of 1.2340 further confirmed by the downward trend line.
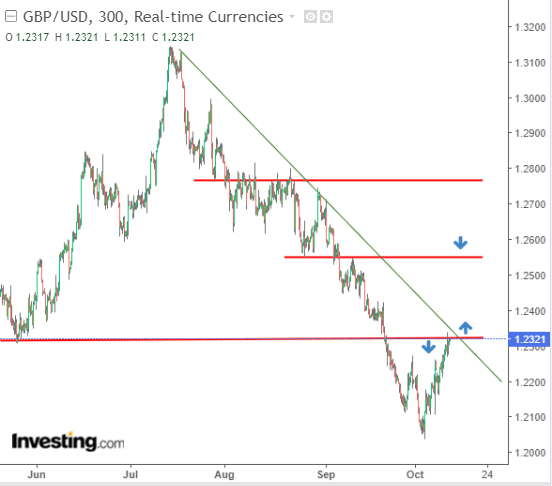 GBP/USD 5-Hour Chart
If we see a break above the indicated area, which, given the dynamics of the rebound, is very likely, then we should look for the next targets slightly below 1.2600.
We will be able to talk about a return to the trend in the situation of the appearance of a clear downward formation with a strong impulse, which will indicate the possibility of negating the current movement in the upward direction.
For bears, the psychological barrier of 1.20 remains an invariable target.
***
 Find All the Info you Need on InvestingPro!